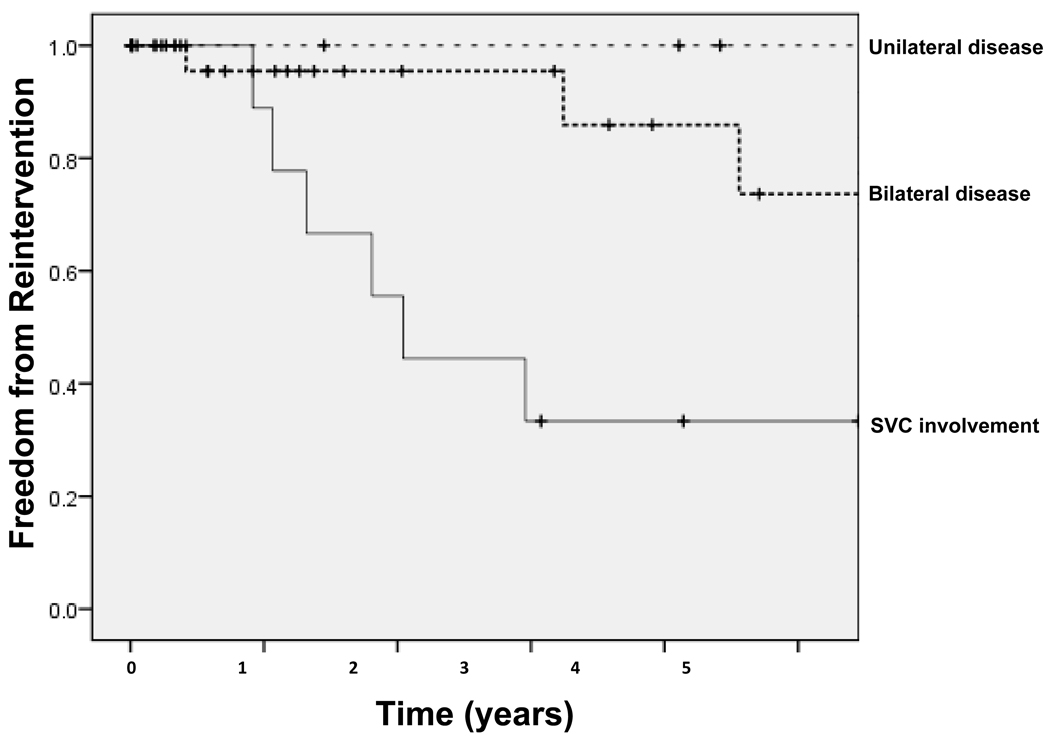
Figure 3. Kaplan-Meier curves demonstrating 5-year freedom from reintervention based on site and extent of vascular involvement.
Thin dotted line indicates those with unilateral pulmonary vascular disease, thick dotted line indicates those with bilateral pulmonary vascular disease, and thin solid line indicates those with unilateral disease and SVC involvement. Hash marks (†) indicate censored subjects.

