Figure 1.
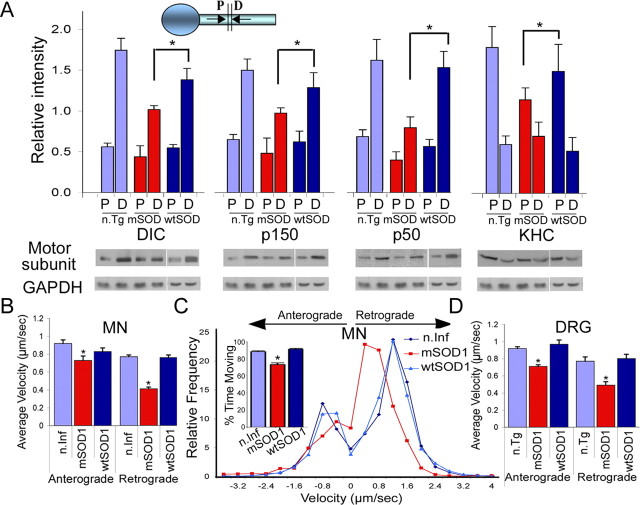
Axonal transport is significantly inhibited in a mouse model of familial ALS. A, Double ligation assays were performed on sciatic nerves of 85-d-old SOD1G93A (mSOD) and age-matched nontransgenic littermate (n.Tg) mice, and transgenic mice overexpressing wild-type SOD1 (wtSOD). Segments immediately proximal (P) and distal (D) to the ligation site were subjected to Western blot analysis for accumulation of KHC, p150Glued subunit of dynactin, and p50-dynamitin subunit of dynactin; GAPDH served as a control. We observed significant differences in both retrograde (DIC, p150, p50) (p < 0.01) and anterograde (KHC) (*p < 0.05) transport compared with n.Tg and wtSOD1 controls. The average of distal and proximal intensity relative to GAPDH from three different experiments is plotted along with SEM. B, D, Live-cell imaging demonstrates slowing of axonal transport in neurons expressing mSOD1. Live imaging using phase optics was used to monitor vesicle transport. The average velocity of retrograde transport in primary motor neurons expressing mSOD1 (B) (n > 40) compared with neurons expressing wtSOD1 or noninfected (n.Inf) neurons and in DRG cultures (D) from 85-d-old mSOD1 mice compared with neurons cultured from littermate controls (n.Tg) or from mice expressing wtSOD1 (n > 30) shows a significant (p < 0.01) reduction. The average velocity of anterograde transport was also significantly reduced (p < 0.05) in MNs expressing mSOD1 (n > 39) and DRGs (n > 17) compared with controls. C, Comparisons of the distribution profiles for instantaneous velocities (n > 2000) show that expression of mSOD1 does not affect the maximum velocity of organelle motility but does induce an overall shift toward lower velocities.

