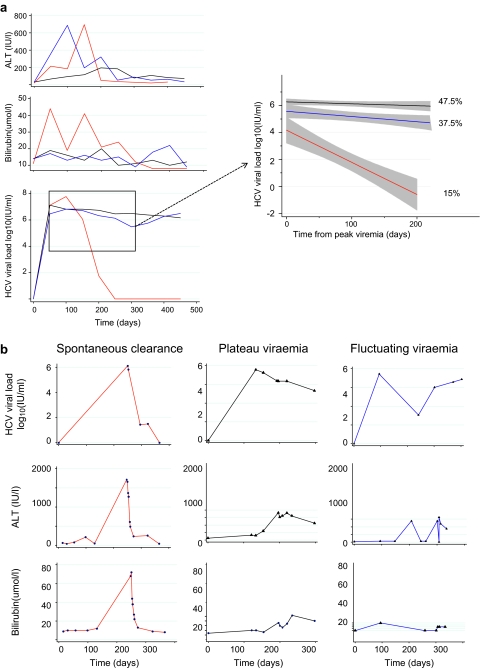
Figure 2.
Clinical measures and outcome in (A) the whole cohort and (B) representative individual patients. Longitudinal hepatitis C virus (HCV) viral load measurements taken prior to treatment revealed three patterns of infection: spontaneous clearance (SC; 15%, red) and two patterns of progression (85%); peak and plateau (PV; 47.5%, black) or fluctuating viraemia (FV; 37.5%, blue) defined as a viral load peak followed by a decline (>1 log10) and subsequent rise in viraemia (>1 log10). Viral loads (VLs) obtained from spontaneous clearers (red), plateau progressors (black) and fluctuating progressors (blue) groups were pooled and plotted using a linear fit model from the time of peak viraemia to 300 days (insert). VL data were right-censored at the time of treatment for HCV. Grey shading indicates 95% CIs.

