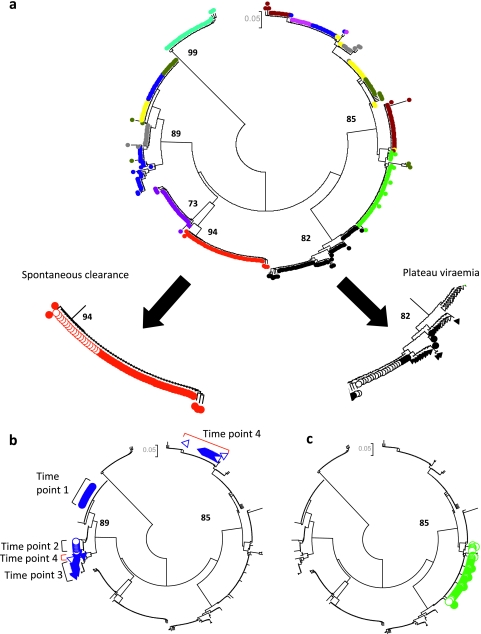
Figure 3.
Patterns of acute HCV based on phylogenetic analysis in subjects 1–10. (A) Spontaneous clearance and plateau progression, (B) fluctuating viraemia associated with superinfection and (C) reactivation. A circular neighbour-joined phylogenetic tree analysis (Kimura 2-parameter model) of 305 HVR-1 sequences derived from subjects 1–10 at 2–4 time points is shown in order to illustrate patterns observed in different patient groups. Similar trees were created for 50 patients. Clones derived from each patient are given a different colour and those from two representative patients are shown in further detail (filled circles represent time point 1, clear circles time point 2, filled triangles time point 3 and clear triangles time point 4). (A) A gradual increase in genetic diversity can be seen in the progressor patient (black), while clones derived from the spontaneous clearer (red) reveal a narrower repertoire. Bootstrap values greater than 70% are shown. (B) A patient with evidence of superinfection is highlighted. Sequences from time point 4 (clear triangles, red brackets) consist of a dominant superinfecting strain (one clone related to the previous lineage is also present). This patient had a fluctuating viral load, with a negative HCV PCR (limit of detection=12 IU/ml) between time points 3 and 4. (C) A case of HCV reactivation is shown. The patient had a sustained virological response (PCR negative 6 months post-treatment) following 48 weeks of IFNα and ribavirin. One year later, he developed a rapid decrease in CD4 count (nadir 106x106/l) and was hospitalised with Pneumocystis jeroveci pneumonia. During this time, his ALT became elevated and HCV RNA was once again detected in his blood. He denied any risk factors for reacquisition of HCV. Branches derived from patient HVR-1 sequences (n=56) are coloured in filled green (baseline sample) and open green (3 years later). These samples derive from the same lineage.

