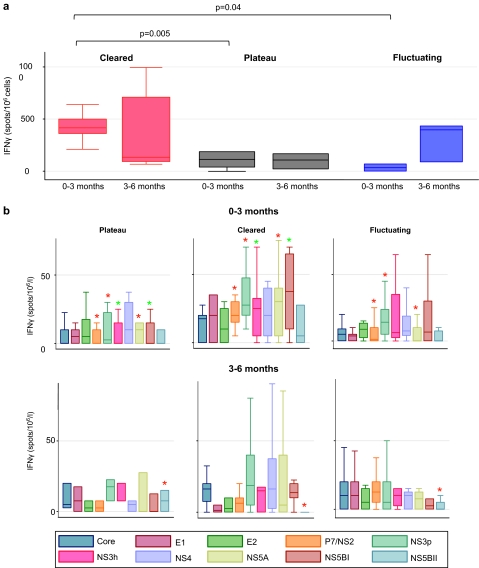
Figure 5.
T cell responses across the hepatitis C virus (HCV) genome at baseline and 3–6 months. (A) Total T cell responses and (B) T cell responses across the HCV genome. T cells responses to pooled peptides spanning the entire HCV genome were assessed by ELISpot in 40 patients with genotype 1a infection at two time points. Significant results (p<0.05) are highlighted with asterisks (red indicates significant difference between SC and both FV and PV patients; green indicates significant difference between SC and PV patients). These responses were measured in total (A) and to 10 overlapping peptide pools (B) from across the entire HCV genome.

