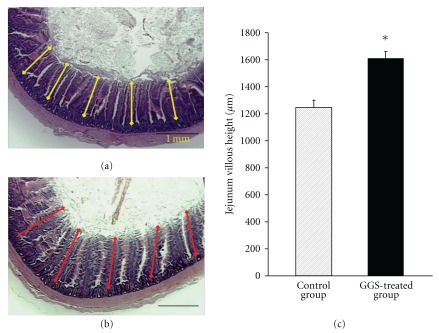
Figure 2.
Effect of GGS on jejunum. Jejunum histology and villous length of chickens fed a basal diet without GGS (control) (a) compared to those fed a basal diet with 0.5% GGS (treatment) (b). For each intestinal section, the jejunum villous height was estimated for at least 10 individual villi in the control and GGS-treated groups, as shown by the yellow and red lines, respectively. The scale bar represents 1 mm. (c) Mean ± SE of jejunum villous height (μm) in control and treated groups. *P < .05.

