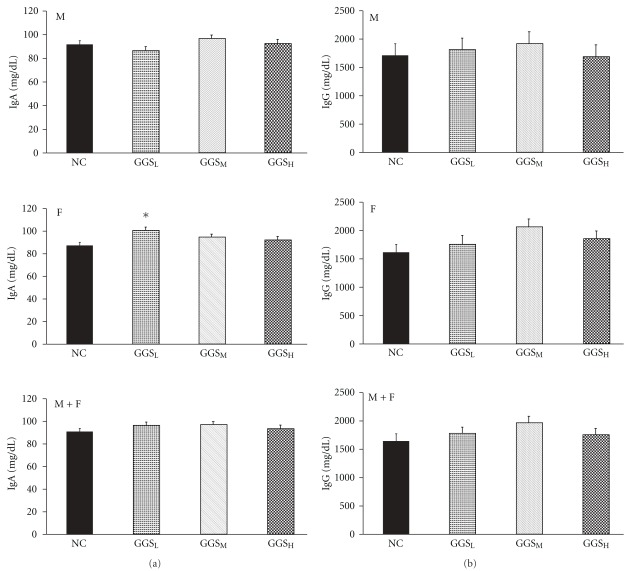
Figure 3.
Effect of GGS on serum IgA (a) and IgG (b). The negative control (NC) group was fed with a basal diet without GGS. The levels of serum IgA and IgG (mg dL−1) in the 0.5, 1 and 2% GGS-treated native chicken groups are shown as GGSL, GGSM and GGSH, respectively. Blood samples were collected at 16 weeks of age. Upper panel (M): Data from male chickens in each group. Middle panel (F): Data from female chickens in each group. Lower panel (M + F): Combined male and female data. The asterisks represent significant differences (P < .05) compared with the respective control groups.

