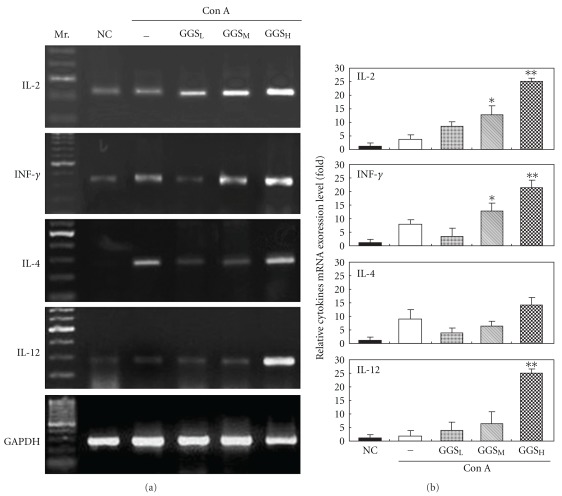
Figure 4.
Quantitative analysis of IL-2, INF-, IL-4 and IL-12 mRNA expression in cultured chicken peripheral lymphocytes treated with different GGS doses at 24 h after ConA stimulation. (a) Representation of mRNA expression by semi-quantitative RT-PCR analysis. Mr.: 100-bp ladder of DNA markers; NC: normal cultured chicken peripheral lymphocytes (Week 8) without ConA stimulation; –: no GGS; GGSL: low-dose GGS treatment group; GGSM: medium-dose GGS treatment group; GGSH: high-dose GGS treatment group. The results are representative of three experiments. (b) The relative mRNA expression levels in control and different GGS-treated groups were quantified by a densitometer. The signal from GAPDH RT-PCR products in each sample was used as an internal control in each mRNA calculation. *P < .05; **P < .01.

