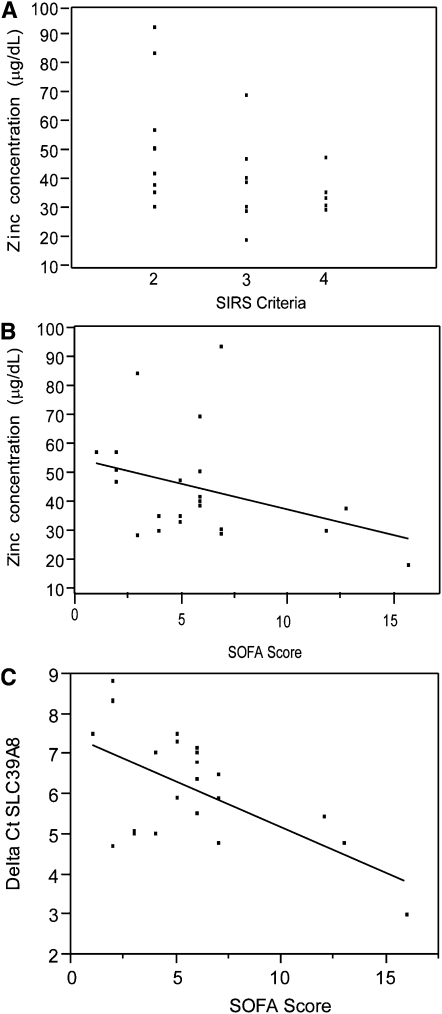
FIGURE 2.
Relations between plasma zinc concentrations or zinc transporter expression compared with severity-of-illness scores in septic patients (n = 22). A: Relation between plasma zinc concentrations (mean ± SD: 45.4 ± 18.1 μg/dL) and systemic inflammatory response syndrome (SIRS) criteria (mean ± SD: 2.73 ± 0.88) evaluated by using Spearman's correlation (P < 0.02). B: Relation between plasma zinc concentrations and Sequential Organ Failure Assessment (SOFA) scores (5.77 ± 3.78) evaluated by Spearman's correlation (P = 0.05). C: Relation between SLC39A8 mRNA expression in blood monocytes [expressed as ΔCt (Delta Ct); mean ± SD: 6.1 ± 1.4] and SOFA scores evaluated by Spearman's correlation (P < 0.03). Lower ΔCt values equated to increased mRNA expression levels; thus, mRNA expression increased as the SOFA score increased. ΔCt = Ct (cycle threshold) target − Ct reference.

