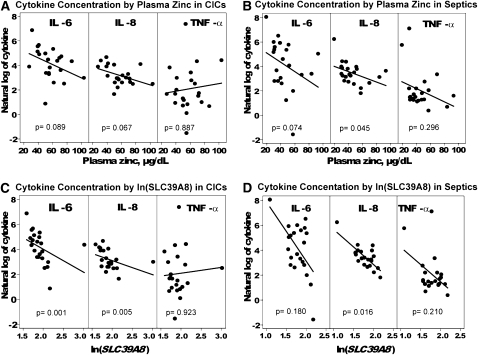
FIGURE 3.
Correlations between plasma cytokine and zinc concentrations in critically ill control (CIC) (A) or septic (B) patients and between plasma cytokine concentrations and SLC39A8 mRNA expression in CIC (C) and septic (D) patients (n = 22 septic and 22 CIC patients). ΔCt and cytokine values were log transformed to obtain a normal distribution and analyzed by Spearman's rank correlation. Lower ΔCt values equated to increased mRNA expression levels; thus, mRNA expression increased as cytokine concentrations increased. P value adjustment was made by using the Holm's procedure for multiple comparisons. ΔCt = Ct (cycle threshold) target − Ct reference.

