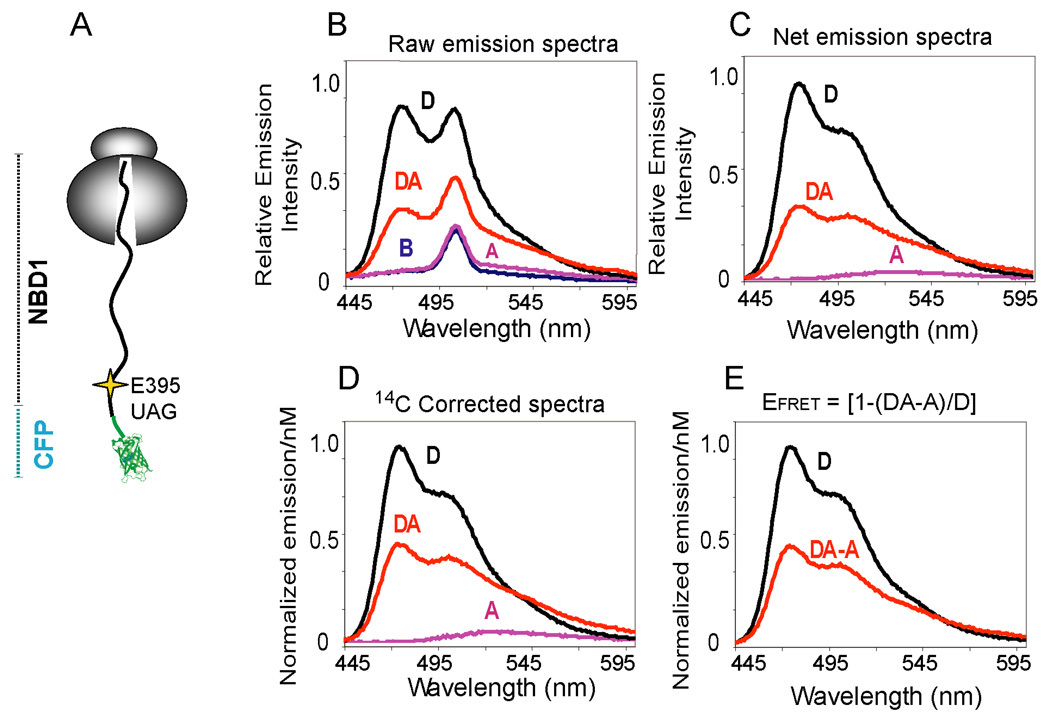
Figure 1.
FRET detection on a ribosome bound nascent chain. (A) Cartoon representation of a ribosome attached CFP-NBD1 fusion protein truncated at CFTR residue 460 shows location of the acceptor dye incorporation site (Thr395). (B) Raw CFP emission spectra (λex = 430 nm, λem = 445–600 nm) obtained from ribosome nascent chain complexes isolated from B, A, D, and DA samples. The background emission peak at ~510 nm is due to water Raman Scatter. (C) Net CFP emission spectra after background subtraction and (D) correction for donor dye concentration based on [14C]Lys incorporation. Normalized emission intensities are shown per nM of donor dye concentration. (E) Corrected and normalized emission spectra after subtracting fluorescence of A from DA to correct for direct excitation of acceptor.

