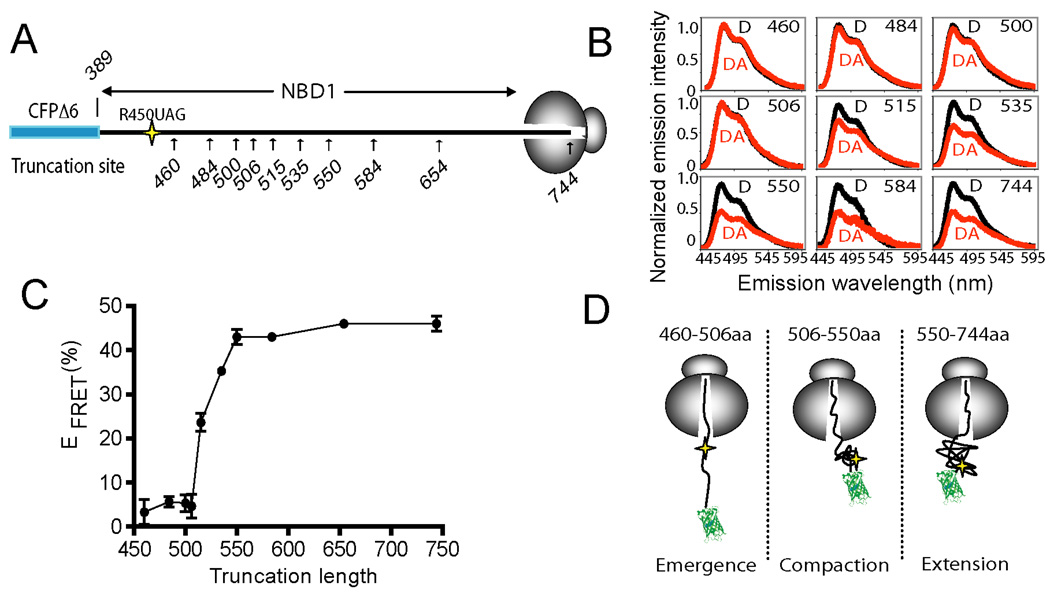
Figure 4.
Vectorial folding of NBD1. (A) Schematic of CFP-NBD1 fusion protein showing approximate location of acceptor dye (residue 450) and truncation sites used to generate RNCs. (B) Selected corrected CFP emission spectra for D (black) or DA (red) samples as in (A), truncated at the indicated residues. (C) EFRET between CFP and residue 450 plotted as a function of nascent chain length (n = 3, +/− s.e.m. where shown, or average of two experiments for truncations 535, 584 and 654). (D) Schematic showing experimentally derived stages of cotranslational NBD1 folding.

