
Figure 7.
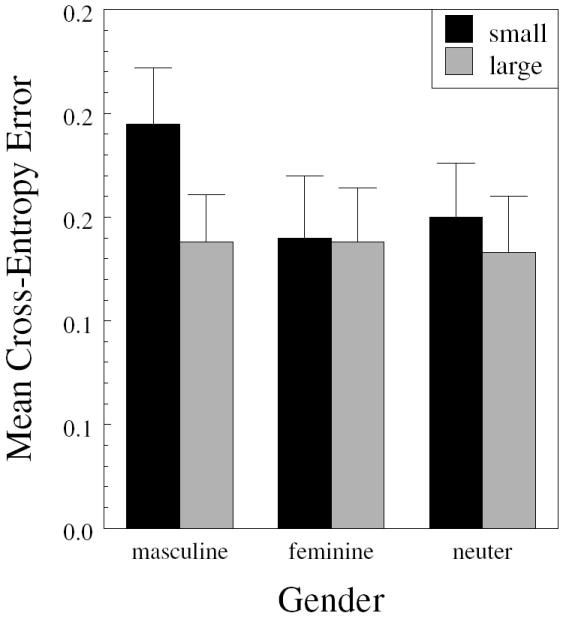
Mean cross-entropy error (adjusted for the covariates, and averaged across 5 runs) for items from small and large neighborhoods across the three genders.
Official websites use .gov
A
.gov website belongs to an official
government organization in the United States.
Secure .gov websites use HTTPS
A lock (
) or https:// means you've safely
connected to the .gov website. Share sensitive
information only on official, secure websites.
Mean cross-entropy error (adjusted for the covariates, and averaged across 5 runs) for items from small and large neighborhoods across the three genders.