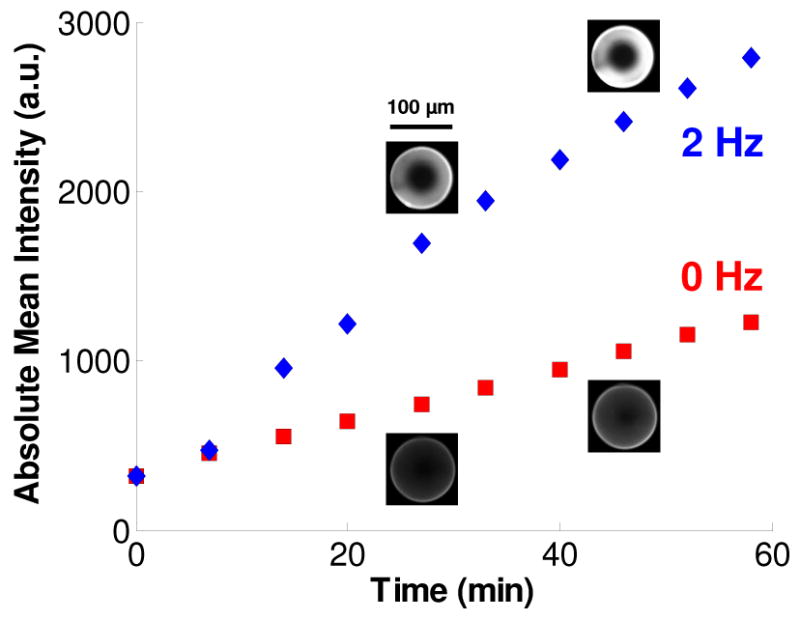
Figure 3.

The signal intensity emitted by functionalized agarose beads in the presence of pulsing (2 Hz) and in the absence of pulsing as functions of time. The micrographs for each bead are at times t = 27 min and t = 46 min. 75 μm tall conduit. 10 nM QDot solution. 10× objective and 30 ms exposure.
