
Figure 6.
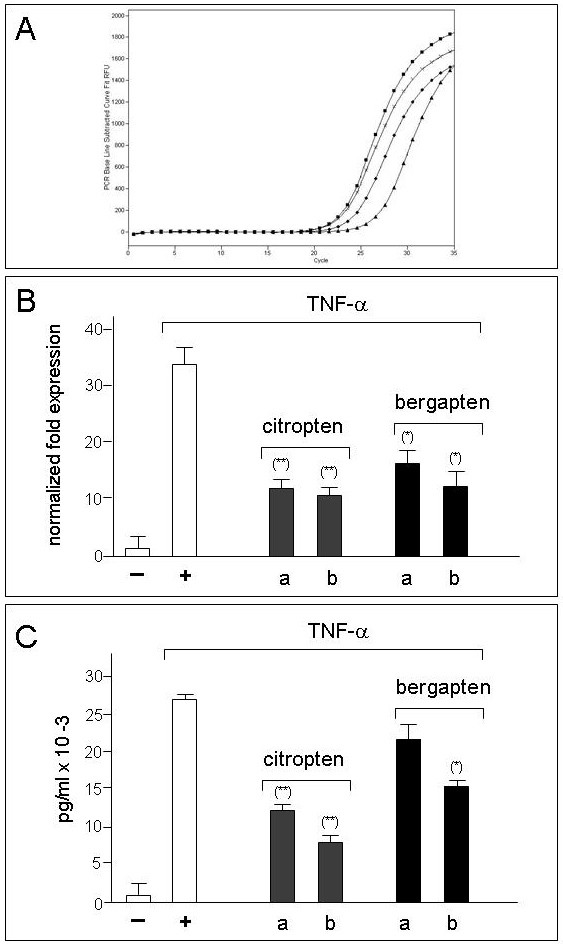
Effects of citropten and bergapten on TNF-α induced IL-8 gene expression in IB3-1 cells. A,B: mRNA accumulation studied by quantitative RT-PCR analysis; C: Bio-plex analysis of IL-8 protein present in supernatants. A. representative RT-PCR analysis. triangles: untreated IB3-1 cells; squares: TNF-α treated IB3-1 cells; diamonds: IB3-1 cells treated with citropten; crosses: IB3-1 cells treated with bergapten. B: Summary of the effects of citropten and bergapten on IL-8 mRNA accumulation with respect to β-actin transcripts. B: Bio-plex analysis, using the Bio-Plex human cytokine IL-8 single-plex (Bio-Rad). (-): untreated IB3-1 cells; (+):IB3-1 cells treated with TNF-α. Results represent the average ± S.D. of three independent experiments. For each experiment duplicate RT-PCR determinations were performed. (*) p < 0.05.