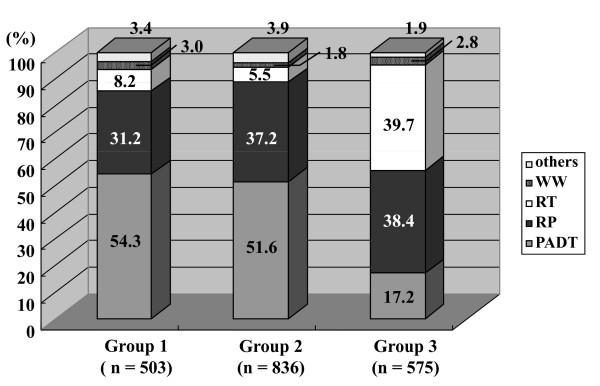
Figure 4.
The distribution of the primary therapy at each hospital group in patients with cT1-3N0M0 (Chi-square test; < 0.001,). Group 1; The hospitals with 10 RP cases or less per year. Group 2; The hospitals with 11 to 30 RP cases per year. Group 3; The hospitals with greater than 30 RP cases per year. RP; radical prostatectomy, PADT; primary androgen deprivation therapy, RT; radiation therapy, WW; watchful waiting.

