
Figure 5.
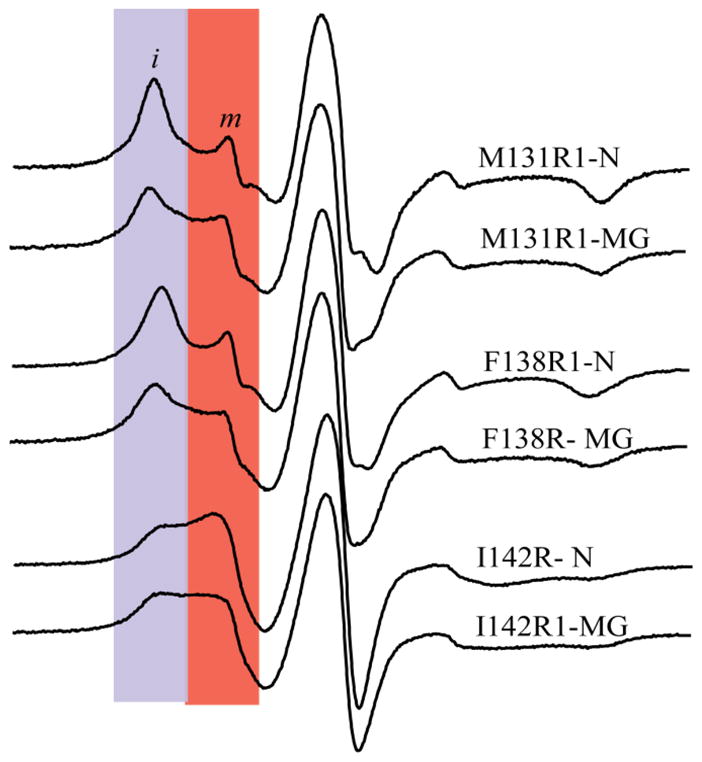
EPR spectra of R1 at the buried sites. Regions shaded in blue and red identify relatively immobile (i) and mobile (m) states, respectively. The m population of M131R1 and F138R1 in the N state is ≈ 5% (Table S1) and likely arises from a small amount of free spin label or unfolded protein. This amount is negligible for DNP so we only consider the i component in the discussion of the N state. In the MG states of M131R1 and F138R1 the m component is ≈ 40% and contributes significantly to the DNP experiments. For I142R1, both i and m components are important in the N and MG states.