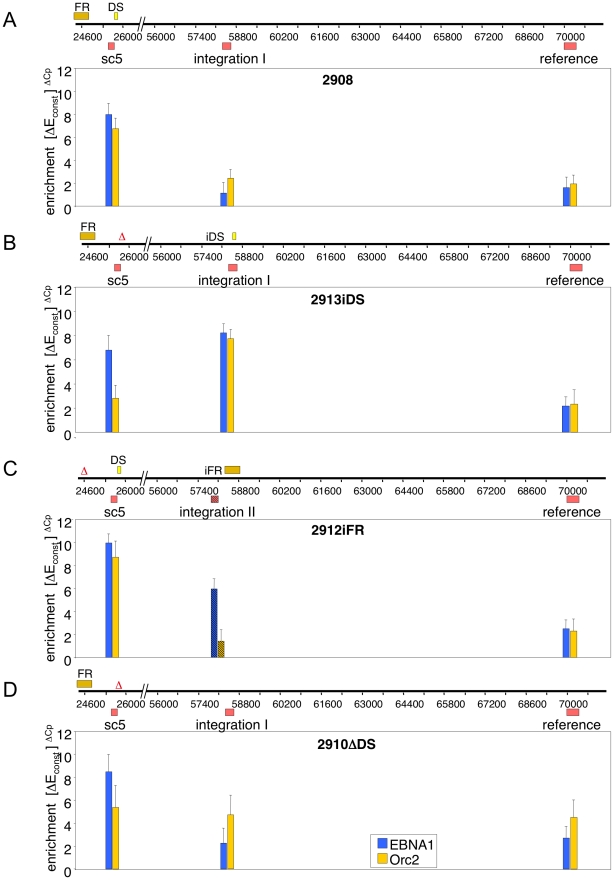
Figure 2. The DS-element is sufficient for site-specific association of ORC.
The various mini-EBV mutants were subjected to ChIP-experiments with antibodies directed against EBNA1 and HsOrc2. A linear representation of the mini-EBV genomes is depicted. The different oriP-mutants are shown (A–D). FR and the DS are shown as yellow boxes, the deleted element as Δ. The positions and designations of the PCR fragments used to scan the binding of Orc2 and EBNA1 are depicted above the maps and include sc5 (oriP region), integration I and II and the reference site. Crosslinked chromatin of 5×10⁶ cells was isolated and used for each immunoprecipitation and an 1/50 aliquot was used for each PCR. The histogram shows the result of EBNA1 (blue bars) and HsOrc2 (yellow bars). The bars show the difference between the efficiencies (ΔCp) of the specific immunoprecipitates and the isotype controls. The values are represented on the logarithmic y-axis. The graph shows the mean value and standard deviations of at least three experiments. The PCR-fragment integration II (striped bar) was used for the mutant iFR(p2912) because the FR could not be amplified by PCR.

