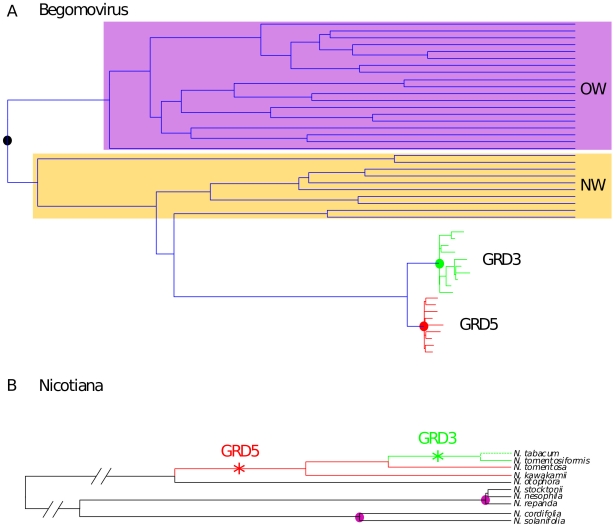
Figure 2. Schematic representation of dataset phylogenies and the calibration points used to estimate begomovirus long-term nucleotide substitution rates.
(A) Begomovirus phylogentic tree with the Old-World (OW) and New-World (NW) sequences indicated in purple and orange respectively. The node representing the most recent common ancestor of the OW and NW begomoviruses is indicated by a black circle. GRD3 (green) and GRD5 (red) sequences are grouped with the New World begomoviruses with the nodes representing ancestral integrons indicated with green and red circles. (B) Partial representation of the Nicotiana phylogenetic tree that was used to infer the dates of GRD sequence integration events. The branches labelled with stars represent ancestral lineages within which GRD5 and GRD3 integrations occurred. Circles in purple are nodes that can be dated based on Nicoticana speciation events associated with the geographical isolation of certain Nicotiana lineages on Pacific islands with inferable geological ages.

