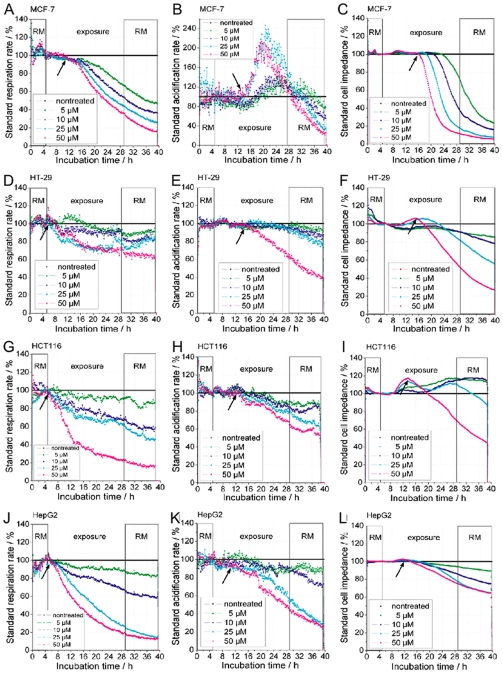
Figure 2. Real-time response profiles of cellular respiration, glycolysis, and impedance upon cisplatin treatment.
Cisplatin treatment started after 5 h of equilibration of cancer cell tissue cultures in the biosensor chip system and was continued over 24 h. RM (running medium) marks cisplatin-free medium; exposure marks time when cisplatin was presented at indicated concentrations (cisplatin-free control, 5 µM, 10 µM, 25 µM, 50 µM). A,D,G,J, change in respiration (oxygen in the medium), B,E,H,K, glycolysis, depicted as change in acidification of the medium (extracellular pH), C,F,I,L, change in impedance of the cell layer (potential between interdigitated electrodes) using four cancer cells lines, A,B,C, MCF-7, D,E,F, HT-29, G,H,I, HCT-116, and J,K,L, HepG2. Arrows indicate the time points of significant changes at the highest concentration (50 µM) of cisplatin used.

