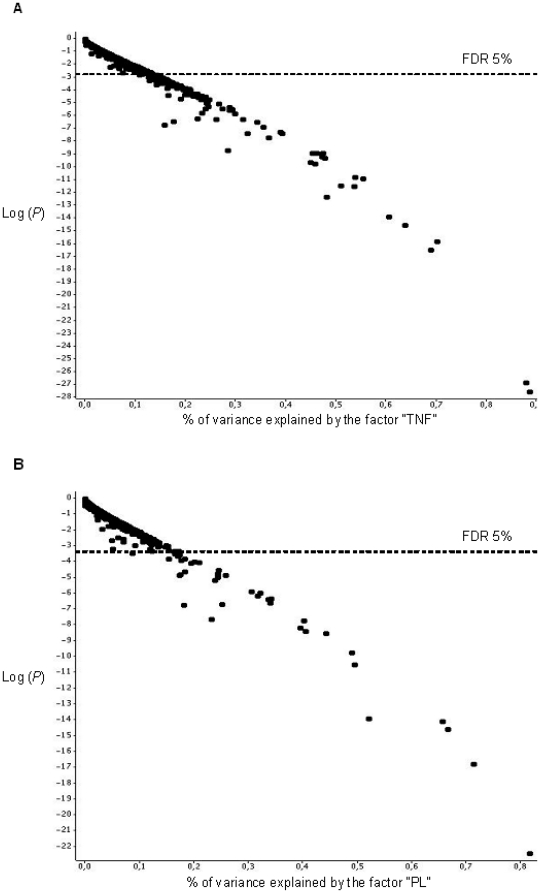
Figure 2. Gene expression variance analysis.
Each gene was plotted as a point. The abscissa is the variation due to the factor normalized by the total variation of the gene, and the ordinate is the logarithm of the P-value. The nominal P-value that corresponded to a FDR of 5% is stated. The results are shown for the TNF (A) and PL (B) factors.

