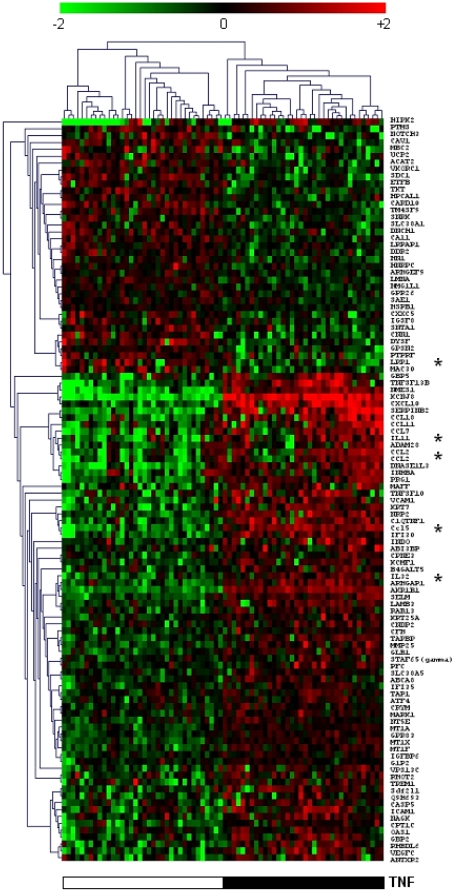
Figure 3. Hierarchical clustering of TNF-induced genes.
Hundred and seven TNF-induced genes were selected on the basis of a Welch t-test and a FDR of 5%. The samples obtained from HBEC stimulated with TNF were compared with those from HBEC incubated without TNF. The presence (black) and the absence (white) of TNF are shown. Genes marked with an asterisk were validated by RT-qPCR.

