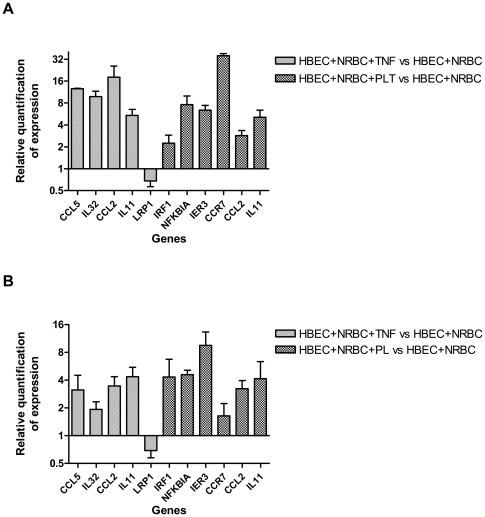
Figure 6. Comparison of the expression of selected genes assessed by RT-qPCR and by microarray technology.
Five TNF-induced genes and 6 PL-induced genes were selected from the list of genes identified through Welch t-tests and multiple test corrections. For 2 genes (CCL2 and IL11), gene expression was regulated by TNF and PL. HBEC were co-cultured with NRBC in the presence or the absence of either TNF or PL to measure the expression of TNF- or PL-specific genes, respectively. A) Gene expression was assessed by RT-qPCR. Data were analyzed by the 2−ΔΔC(t) method with ACTB as a control gene. The n-fold value represents the mean of TNF- and PL-induced expression levels compared with control conditions. Error bar represents SD between duplicates. B) Gene expression was assessed by microarray technology. The n-fold value was calculated on the basis of normalized data when comparing the levels of TNF- and PL-induced expression with those of control conditions. Error bar represents SD between triplicates.

