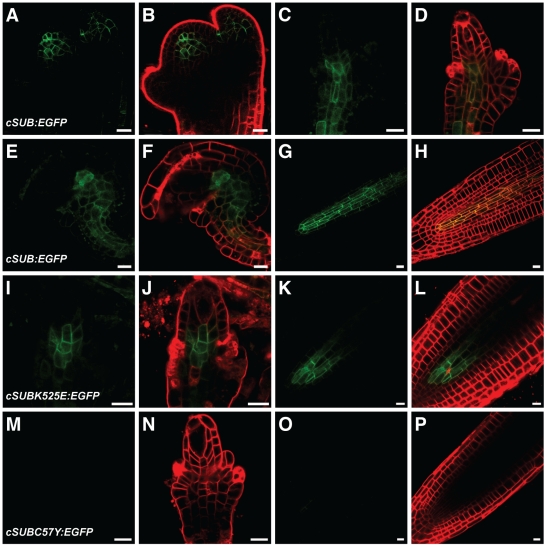
Figure 7. Expression analysis of different SUB::cSUB:EGFP-based reporters.
Live confocal microscopy images obtained from Ler plants carrying various cDNA-derived SUB:EGFP reporters. The FM4-64 stain was used to mark the outline of all cells in a tissue. Signals from the EGFP and FM4-64 channels are shown in green and red, respectively. Stage 3 floral meristems (A–B), stage 2-III (C–D, I–J, M–N) and 3-V/VI ovules (E–F), and roots from 4-day old seedlings (G–H, K–L, O–P) are depicted. (A–H) SUB::cSUB:EGFP. Weak signals are only detected in the center of the different organs. (I–L) SUB::cSUBK525E:EGFP. Weak signal that is noticeably restricted to the interior part of ovules and roots. (M–P) SUB::cSUBC57Y:EGFP. No detectable signal in ovules or roots. Scale bars: 10 µm.

