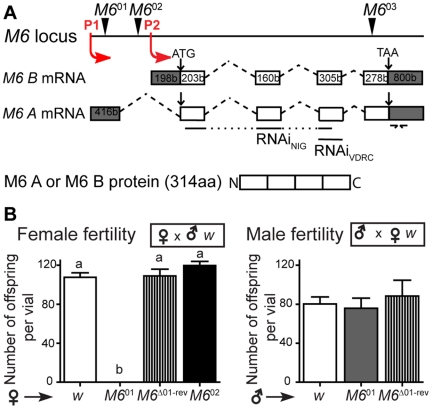
Figure 1. M6 01 displays female fertility defects.
(A) Schematic diagram of the M6 locus showing the mRNA isoforms (A and B) transcribed from promoters P1 and P2. Exons and introns are indicated by boxes and dashed lines, respectively. Grey boxes represent untranslated regions (UTR) and white boxes highlight coding regions. Both isoforms are translated into the same protein (M6 A/B-314 residues). The location of independent P-element insertions resulting in potential M6 mutants is indicated by arrowheads (M6 01 for M6EY07032, M6 02 for M6BG00390 and M6 03 for M6MB02608). Lines point to sequences targeted by UAS-M6-RNAi stocks. The representation is not scaled. Primers employed to quantify M6 mRNA levels by RT-qPCR are indicated by arrows in the 3′UTR. (B) Fertility assessment of potential M6 mutants. Female and male fertility was independently measured as the number of offspring per vial obtained when crossed to wild type flies (w), as indicated in the figure. The sterility phenotype of M6 01 females was reverted by P-element excision. The excised line, termed M6 Δ01-rev, still contained 50 bp from the original P-element. Mean ± s.e.m., n = 2–3; Kruskal-Wallis test, p<0.001 for female fertility, p>0.05 for male fertility. Different letters indicate significant differences (p<0.01).

