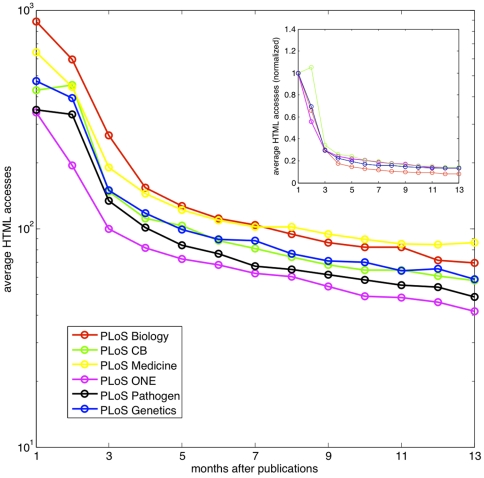
Figure 2. The average number of HTML views of articles in six PLoS journals.
We study the access statistics of 7000 publications that have been published for at least one year. These publications belong to 6 different PLoS journals: PLoS Biology (1177), PLoS Computational Biology (688), PLoS Genetics (723), PLoS Medicine (1300), PLoS One (2796) and PLoS Pathogen (543). In average, the number of HTML views of an old paper is lower. The decay process is much faster from the first month to the second month after publication, compared to the subsequent period. The inset shows the average accesses of different journals normalized by the corresponding values of the first month. Note that the patterns are remarkably similar for the six different journals.

