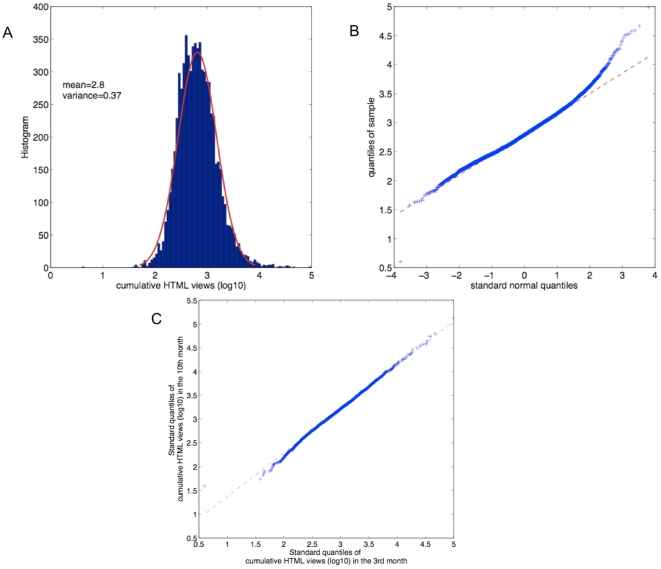
Figure 4. The number of cumulative HTML views follows a long tail distribution, reasonable well fitted by a lognormal distribution.
A. The cumulative number of HTML views of 7000 papers at the 3rd month after publication is fitted using the maximum likelihood method by a lognormal distribution, with the mean and variance of the logarithmic values as shown. B. The normal Q-Q plot of the logarithm of the HTML views shown in panel A. Apart from a slightly longer tail, the plot is close to a straight line, meaning that the majority of the data is well explained by a lognormal distribution. C. The Q-Q plot between the cumulative accesses of the same set of 7000 papers at the 3rd month and at the 10th month after publication. The plot is very close to a straight line, suggesting the cumulative HTML views at different time points follow the same distribution up to certain shift and scaling factors.

