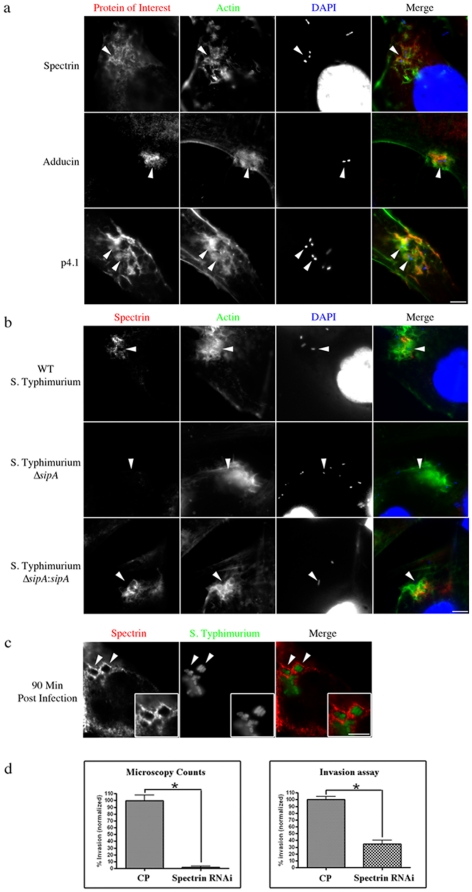
Figure 3. Spectrin cytoskeleton distribution during S. Typhimurium infections.
(a) Immunolocalization of spectrin cytoskeletal elements, spectrin, adducin and p4.1 with actin and DAPI during S. Typhimurium SL1344 invasion in HeLa cells. Actin labeling identified invasion sites with actin-rich membrane ruffles. (b) Images illustrating the inability of a ΔsipA mutant to recruit spectrin to sites of invasion. ΔsipA:sipA restored spectrin recruitment to invasion sites. (c) Spectrin localization to sites of internalized S. Typhimurium SL1344-GFP. Areas of interest are indicated by arrowheads and highlighted in insets. (d) Quantifying invasion efficiency after depletion of spectrin with siRNA as compared to a non-targeting control pool (CP). For each treatment, 3 independent experiments were run; for microscopy counts n = 3, error bars show s.e.m, *P<0.0001 for all statistics. Scale bars are 5 µm.

