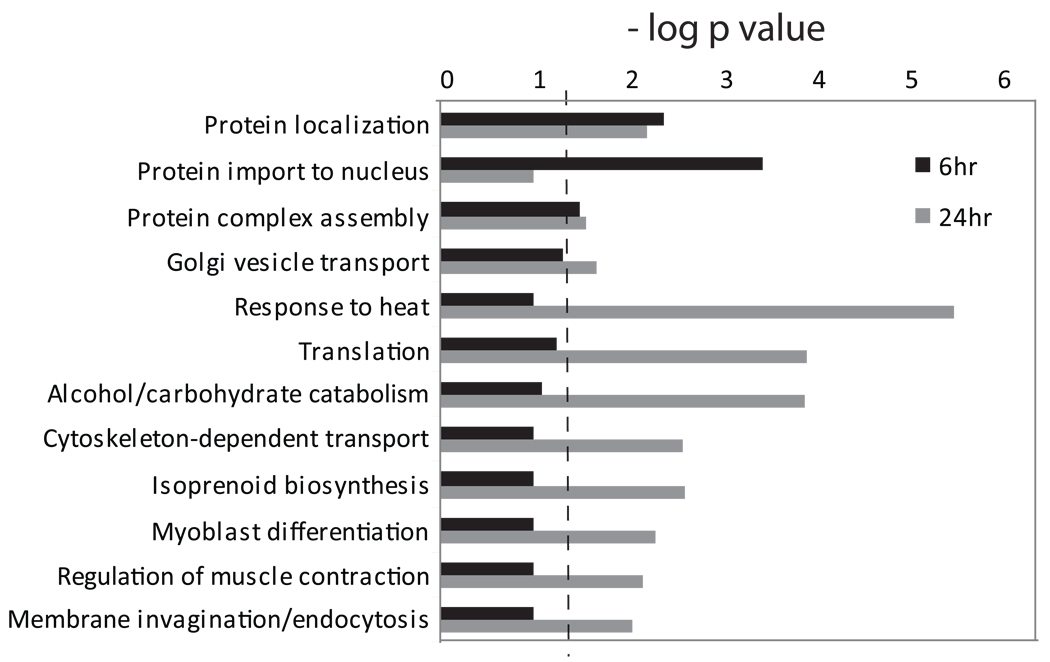
Fig. 4.
Gene ontology analysis of LPA-regulated protein expression. Biological process enrichment was calculated from the MS/MS analysis of MLO-Y4 cells as in Figure 2. The dashed line indicates p = 0.05; all bars that extend to the right of that line were considered to be statistically significant.

