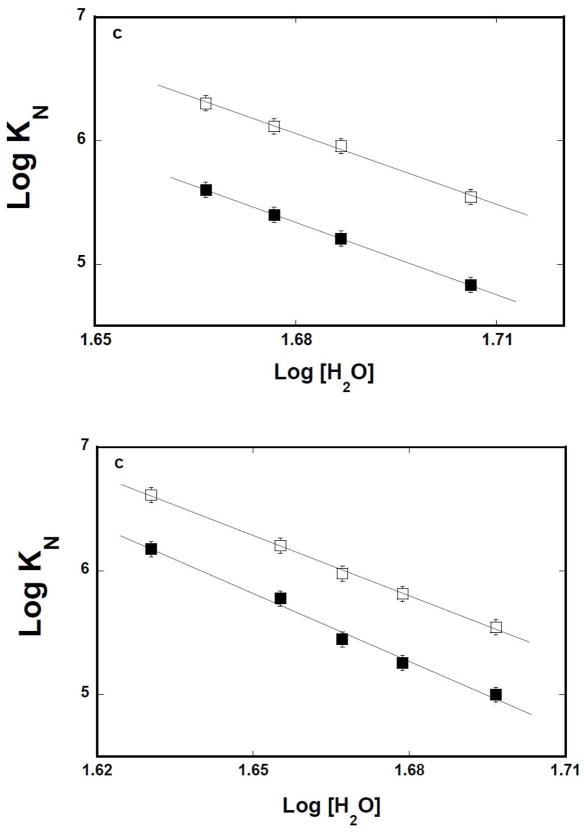
Figure 7.
a. Log-log plots of the net release of water molecules from the 8-kDa domain – ssDNA complexes in the presence of glycerol or DMSO and magnesium. The dependence of the logarithm of the binding constants, K10(■) and K16(❑), upon the logarithm of water concentration, in buffer C (pH 7.0, 10°C), containing 1 mM NgCl 2, in the presence of glycerol. The solid lines are the linear least-squares fits, which provides the slopes, ∂LogK10/∂Log[H2O] = −19.1 ± 2.5 and ∂LogK16/∂Log[H2O] = −19.4 ± 2.5, for the 10-and 16 -mer, respectively (details in text). b. The dependence of the logarithm of the binding constants, K10(■) and K16(❑), upon the logarithm of water concentration, in buffer C (pH 7.0, 10°C), containing 1 mM NgCl2, in the presence of DMSO. The solid lines are the linear-least squares fits, which provides the slopes, ∂LogK10/∂Log[H2O] = −16.2 ± 2.5 and ∂LogK16/∂Log[H2O] = −18.3 ± 2.5, for the 10-and 16 -mer, respectively (details in text).

