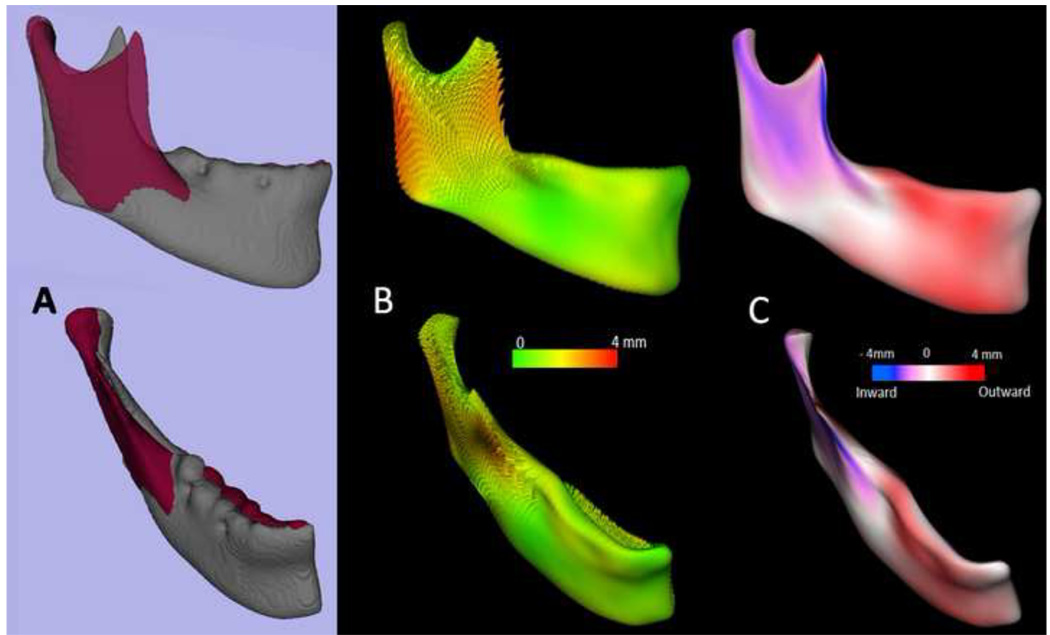
Figure 7. Quantification of mandibular asymmetry for a patient using 3D shape analysis.
(A) original model (grey) and left hemi-mandible arbitrary mirror matching on the cranial base(maroon); (B) shape analysis can be used to quantify the right and left differences as represented in this vectorial color map of the surface distance between the registered original and arbitrary mirror models; (C) Signed color maps showing the directionality of the differences; the left ramus is wider and left corpus is narrower than the right.

