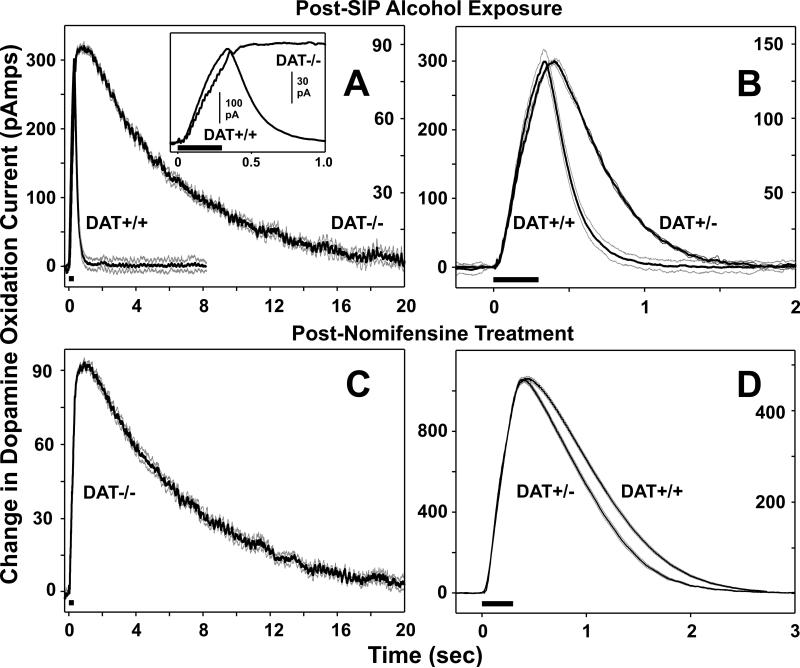
Fig. 4.
Representative examples from individual DAT+/+, DAT+/- and DAT-/- mice depicting the time course for accumbens DA efflux evoked by 15 pulses of medial forebrain bundle stimulation at 50 Hz (black bars). (A) Time course of DA recovery to pre-stimulation levels was significantly prolonged for DAT-/- mice compared to DAT+/+ mice. Left and right y-axis scales correspond to DAT+/+ and DAT-/- responses, respectively. Inset: Expanded time frame for DA responses recorded in DAT-/- and DAT+/+ mice. (B) Time course of DA recovery to pre-stimulation levels for DAT+/- and DAT+/+ mice. As noted in the Results, these two groups differed significantly in this measure. Left and right y-axis scales correspond to DAT+/+ and DAT+/- responses, respectively. (C) Time course of DA recovery to pre-stimulation levels was unaffected following blockade of DATs by nomifensine. In contrast, (D) nomifensine treatment markedly delayed DA recovery in both DAT+/+ and DAT+/- mice. Bold dark lines represent the means and light gray lines the SEMs for six evoked responses recorded in individual mice 5 min before and 30 min after nomifensine administration (10 mg/kg i.p.). All recordings were made at least 1weeks following 10 days of SIP-alcohol. Left and right y-axis scales correspond to DAT+/+ and DAT+/- responses, respectively.

