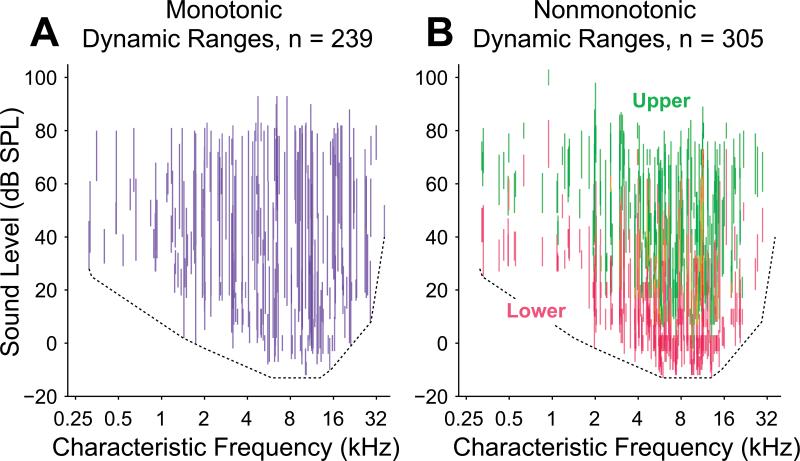
Figure 2.
Dynamic ranges of all neurons in the study population plotted against CF. A, Vertical blue lines connect threshold and saturation for monotonic neurons, visually depicting their dynamic ranges. B, For nonmonotonic neurons, lower (red) and upper (green) dynamic ranges are depicted separately. Alone, each neuronal subpopulation appears be capable of coding most or all combinations of frequency and intensity. Dependence of threshold upon CF is depicted as a dotted line in both panels. This line provides an estimate of the minimum sensitivity of any neuron at a particular frequency (see Methods).

