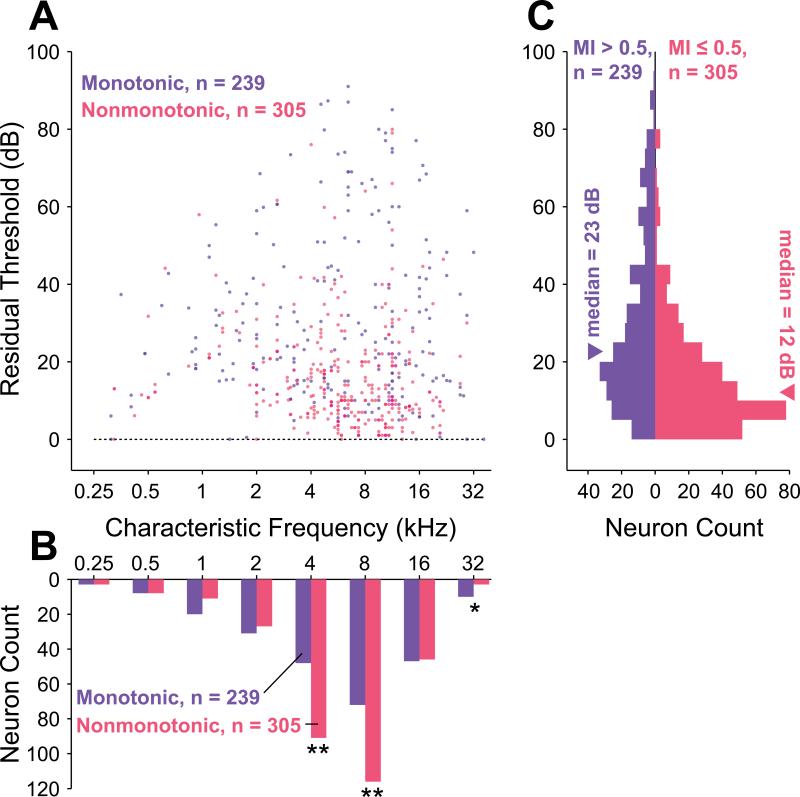
Figure 3.
Comparison of monotonic and nonmonotonic neuron residual thresholds. The residual threshold allows for direct comparison of dynamic ranges across frequency by removing frequency-dependent effects. A, Scatterplot of residual thresholds (i.e., neuronal thresholds with frequency-dependent neuronal threshold subtracted) as a function of frequency for monotonic (blue) and nonmonotonic (red) neurons. Overlapping points have their colors superimposed. B, Monotonic and nonmonotonic neurons were separately collected into one-octave frequency bins based upon CF to evaluate their relative distribution across frequency. Frequency bins centered at 4 and 8 kHz contained significantly more nonmonotonic than monotonic neurons (p = 1.7×10⁻⁴ and p = 8.2×10⁻⁴, respectively; binomial test), and the frequency bin centered at 32 kHz contained significantly more monotonic than nonmonotonic neurons (p = 0.046, binomial test). These bins are marked with asterisks. C, Collapsing residual thresholds across frequency reveals that the distribution of nonmonotonic neurons (median = 12 dB, interquartile range = 15 dB) has a lower central tendency and a smaller range than that of monotonic neurons (median = 23 dB, interquartile range = 28 dB). These two distributions are significantly different (p = 7.2×10⁻¹⁶, Wilcoxon rank sum test).

