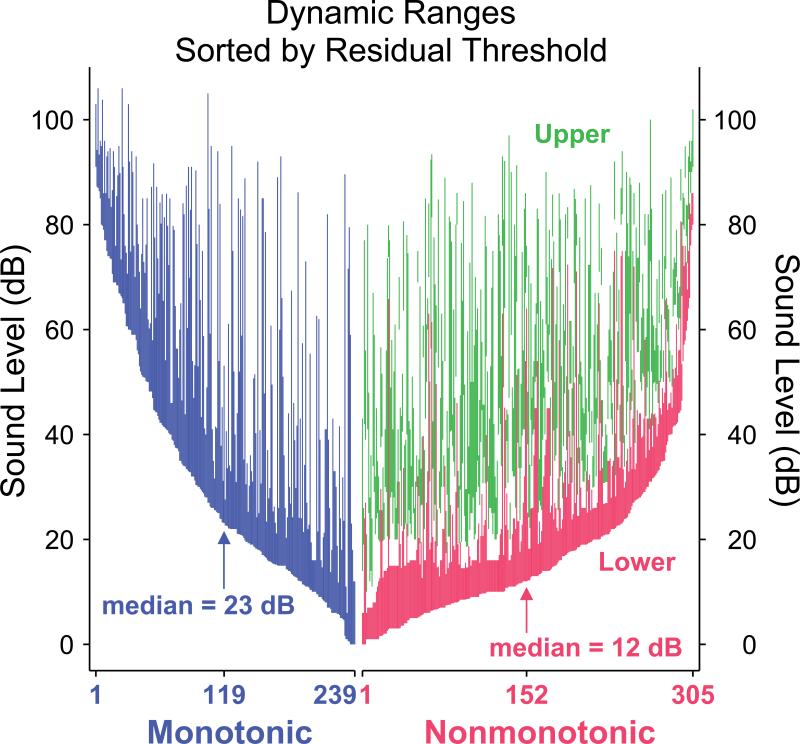
Figure 4.
Monotonic (blue), nonmonotonic lower (red) and nonmonotonic upper (green) dynamic ranges, sorted by residual threshold separately for the monotonic and nonmonotonic populations. Visualizing in this manner shows the clustering of nonmonotonic thresholds closer to the minimum neuronal threshold (at 0 dB residual threshold). Also apparent is that neurons in either population can potentially encode intensities across the entire range of sound levels tested regardless of threshold.

