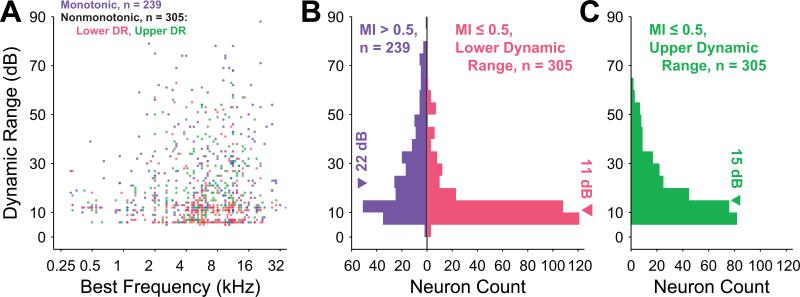
Figure 5.
Dynamic range magnitudes for monotonic neurons (blue) and of lower (red) and upper (green) dynamic ranges for nonmonotonic neurons. A, Dynamic ranges as a function of CF reveal that the maximum dynamic range at a particular frequency is limited by the frequency dependence of the thresholds. Overlapping points have their colors superimposed. B, Distribution of dynamic ranges for monotonic neurons and of lower dynamic ranges for nonmonotonic neurons reveals a significantly lower median for nonmonotonic neurons (p = 8.0×10⁻²², Wilcoxon rank sum test). C, Median of nonmonotonic upper dynamic range distribution is between the medians given in B and is significantly different from both (p = 0, Kruskal-Wallis test with Tukey-Kramer correction for multiple comparisons).

