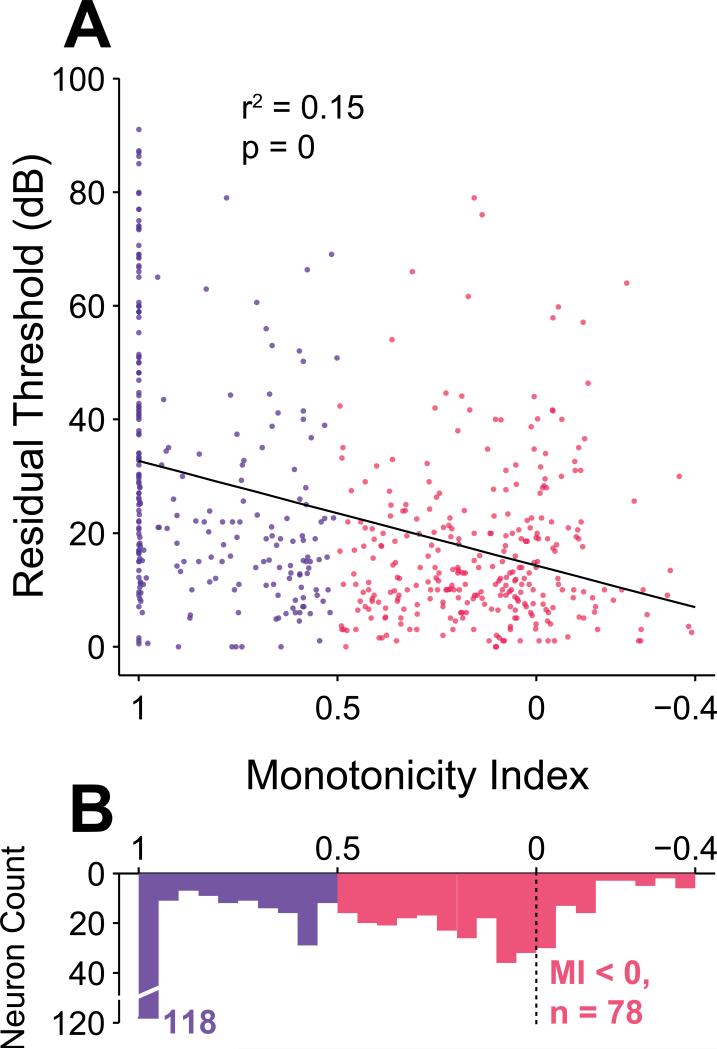
Figure 6.
Residual threshold and monotonicity are correlated. A, Scatter plot reveals that the highest residual thresholds are concentrated in the most monotonic subpopulation. Linear regression indicates that threshold and MI are significantly correlated across the entire population (r2 = 0.15; p = 0, regression F test). Three neurons with MI < –0.4 were not included in the regression and are not depicted in the scatterplot. B, Distribution of MI values with a large cluster of very monotonic neurons having MI equal to 1, and a large cluster of neurons having MIs less than or equal to 0.

