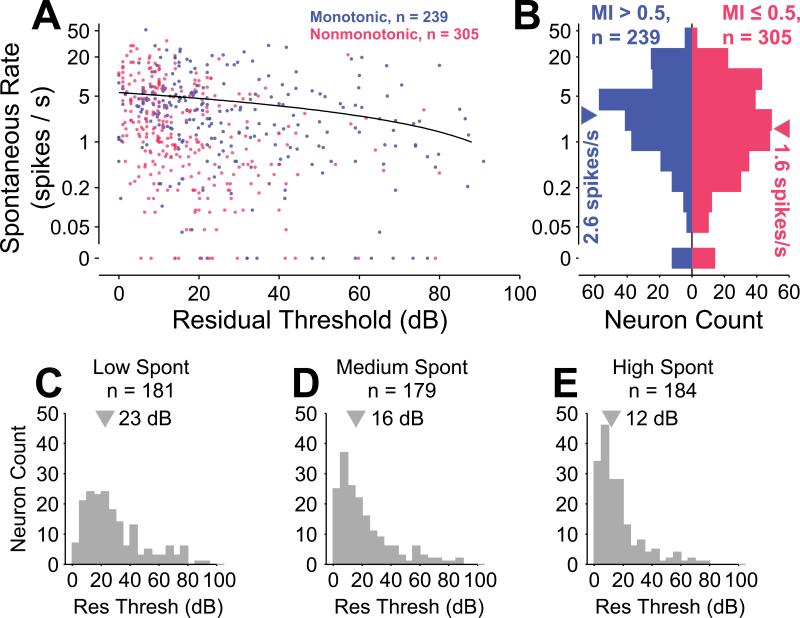
Figure 7.
Spontaneous rate and residual threshold are weakly correlated. A, Scatterplot of spontaneous rate versus residual threshold for monotonic (blue) and nonmonotonic (red) neurons reveals that neurons in either population with higher residual thresholds tend to have lower spontaneous rates. Overlapping points have their colors superimposed. A linear regression of this trend reveals a significant, though small effect (r2 = 0.026; p = 1.5×10⁻⁴, regression F test). The regression was performed on a linear scale, leading to a curved line on this logarithmic plot. B, Collapsing across residual threshold reveals a significant difference between distributions of spontaneous rates for monotonic and nonmonotonic neurons (p = 0.014, Wilcoxon rank sum test). C–E, Residual threshold differs between groupings into approximate tertiles of spontaneous rate (rate ≤ 0.95, 0.95 < rate ≤ 4, rate > 4).

