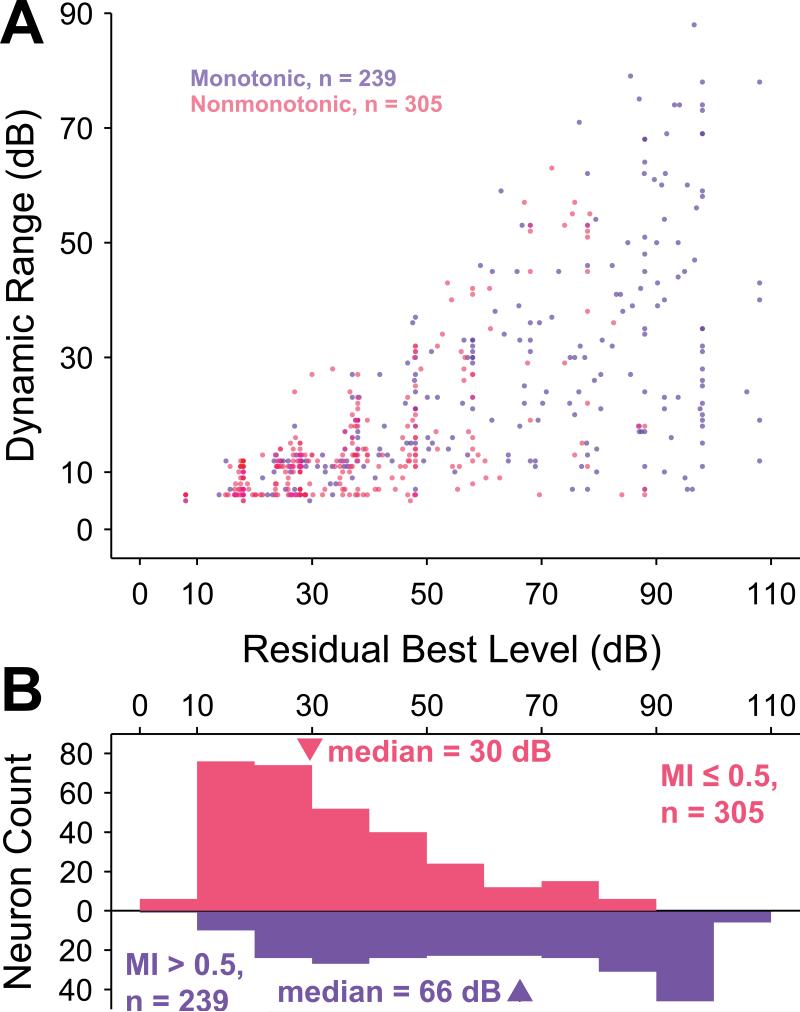
Figure 9.
BL and dynamic range are correlated. A, Scatterplot of BL versus dynamic range for monotonic neurons (blue) and lower dynamic range for nonmonotonic neurons (red) reveals an apparent relationship, even though the dynamic range bounds are functions of BL. B, The distributions of BL for monotonic and nonmonotonic neurons are significantly different (p = 3.8×10⁻³², Wilcoxon rank-sum test). The monotonic BL distribution is relatively uniform except for a cluster of neurons with MI equal to 1 (74 / 239), whose BLs are limited by the greatest sound intensity level presented to the neuron. The distribution of BLs for nonmonotonic neurons is skewed towards lower sound levels.

