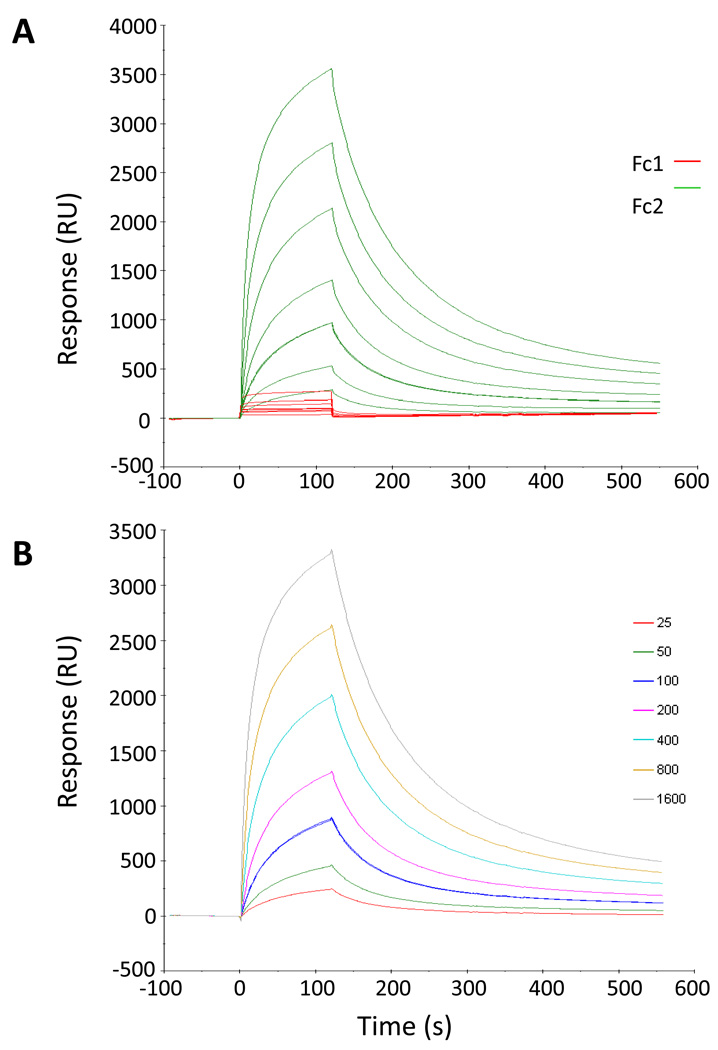
Figure 2.
Example of SPR sensorgram adjustment. (A) Inactive linear compstatin (Peptide I) used as a control in flow cell one (Fc1) is shown in red. Peptide VII in flow cell two (Fc2) is shown in green. (B) Adjusted sensorgram of Peptide VII by taking the difference Fc2-Fc1. The color code corresponds to C3 concentrations shown in the legend at the right.

