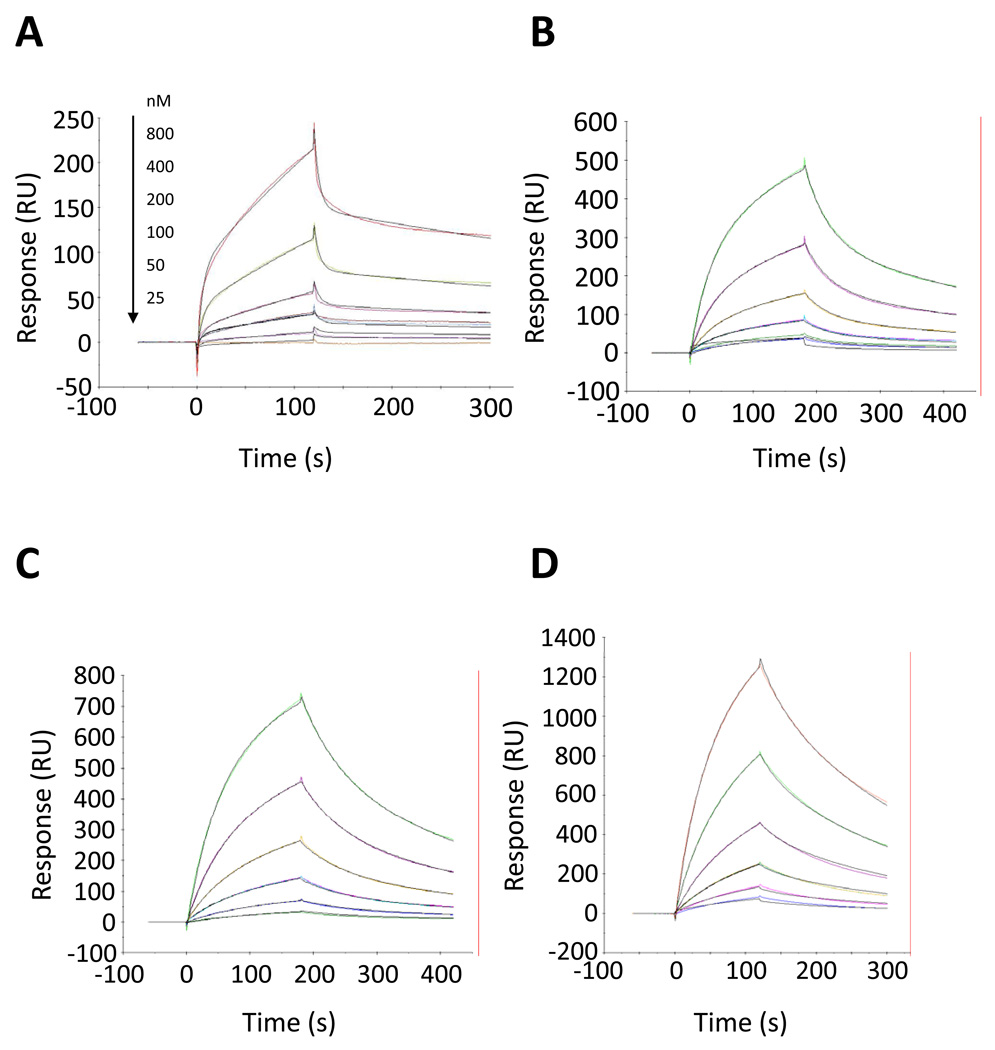
Figure 4.
Kinetic analysis of Peptides VI–IX to human C3. The C3 concentrations are 800, 400, 200, 100, 50, and 25nM (from top to bottom). Solid color lines correspond to the experimental data and solid black lines correspond to the fits. Solid color lines correspond to the experimental data and solid black lines correspond to the fits. All sensorgrams were fitted to a two-state reaction model. The panels show: (A) Peptide VI, (B) Peptide VII, (C) Peptide VIII, and (D) Peptide IX.

