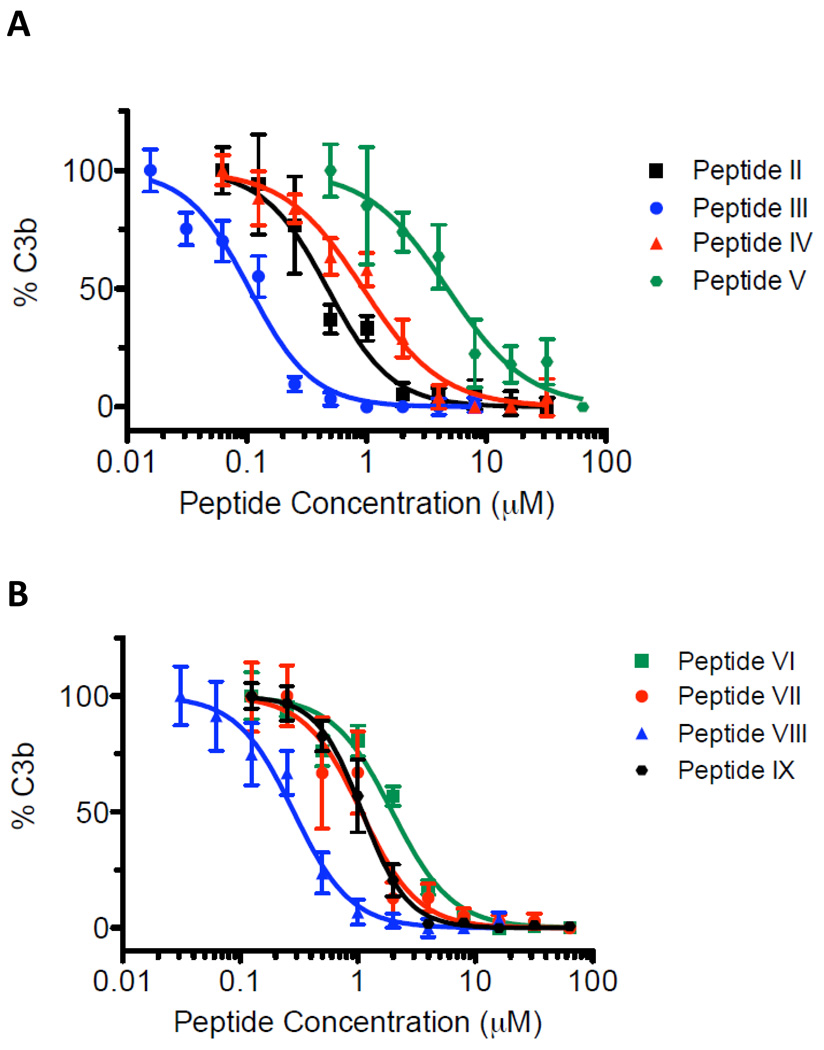
Figure 5.
Human C3b ELISA data used to extract the IC50 values of Table 3. Peptide concentration is plotted in the horizontal axis and percent C3b is plotted in the vertical axis. The plots depict the inhibition of cleavage of C3 to C3a and C3b by compstatin peptides, quantified as percent of generated C3b. Highest inhibition corresponds to 0% C3b generation.

