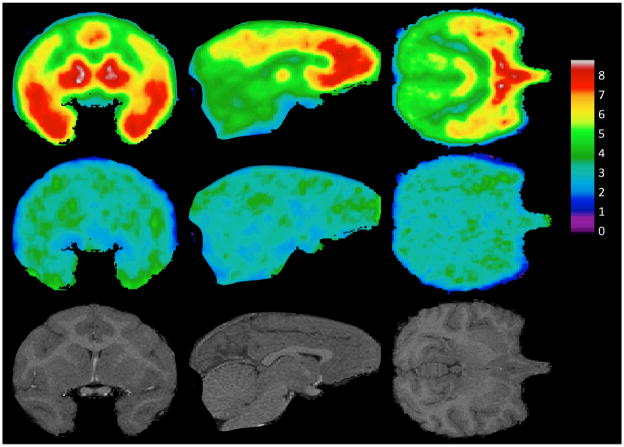
Figure 1. Mean PET images under normal (top row) and block (middle row) conditions, and Magnetic Resonance Images (bottom row).
Coronal, sagittal, and axial views of the baboon brain are shown in the left, middle, and right columns respectively. For each PET image acquired under normal conditions (i.e. without administration of MTEP, n=9) or under block conditions (n=3) the volume of distribution (VT) was calculated at every voxel using the Logan graphical approach [49]. The mean of each set of VT voxel maps is shown. (See text for explanation.) The bottom row shows coronal, sagittal, and axial views of the magnetic resonance image of baboon #1, for anatomical reference.

