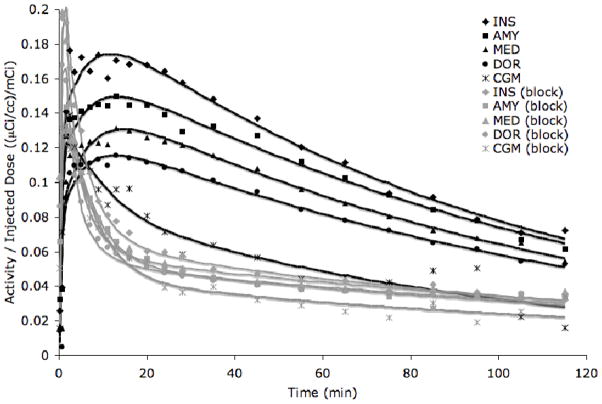
Figure 2. Time activity curves of five regions in baseline (black) and block (grey) conditions.
The activity in the insula (INS), temporal lobe (TEM), medial prefrontal cortex (MED), dorsal and lateral prefrontal cortex (DOR), and cerebellar grey matter (CGM) in one test/block study is plotted over time. The raw data (symbols) was fit with an unconstrained two-tissue compartment model (solid lines). The MTEP block lowered activity in high binding regions. Some reduction of activity in the cerebellar grey matter is also apparent.

