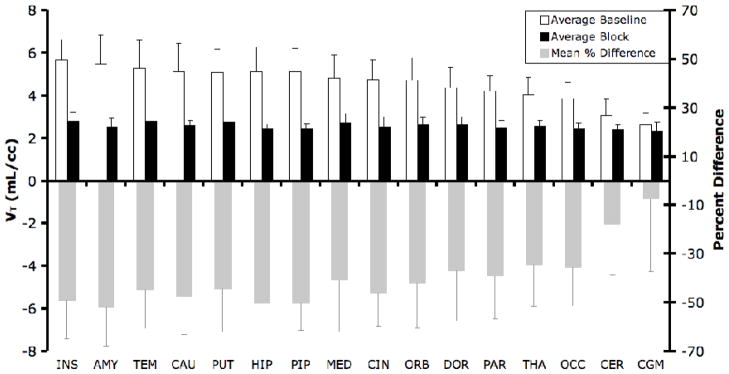
Figure 3. Comparison of VT in baseline (n = 3) and block experiments (n = 3).
Baseline VT values (white bars) are significantly higher than block VT values (black bars). Regions are organized from left to right in order of highest to lowest mean baseline binding. The smallest difference between baseline and block is observed in the cerebellar grey matter (CGM). Also seen here is the percent difference in test/block pairs (grey bars). INS: insula; AMY: amygdala; CAU: caudate; TEM: temporal lobe; PUT: putamen; HIP: hippocampus; PIP: parahippocampal gyrus; MED: medial prefrontal cortex; CIN: cingulate; ORB: orbital prefrontal cortex; DOR: dorsal and lateral prefrontal cortex; PAR: parietal lobe; THA: thalamus; OCC: occipital lobe; CER: cerebellum; CGM: cerebellar grey matter.

