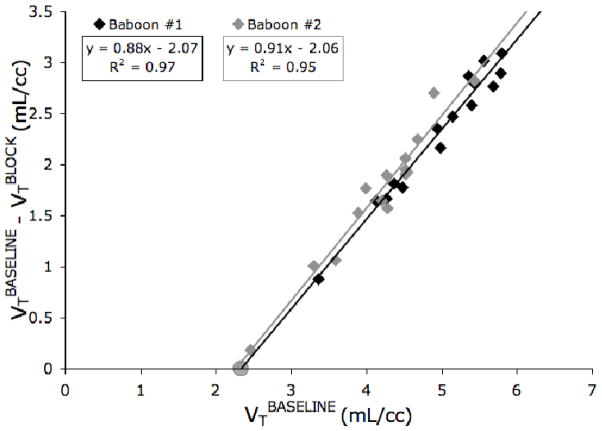
Figure 4. Lassen Plot.
The data for baboon # 1 (black diamonds) is averaged over two test/block studies, while the data for baboon # 2 (grey diamonds) is from one study. The equations and goodness of fit of the regression lines (grey and black lines) are indicated in the boxes. Fitted slopes represent the estimated occupancy, which is assumed constant over all regions. The x-intercept of the regression lines, 2.35 mL/cc and 2.27 mL/cc for baboons 1 and 2, respectively, is an estimate of nonspecific binding. The average post-block VT of cerebellar grey matter is indicated by the gray circle (2.33 mL/cc). This ROI was not included in the regression analysis.

