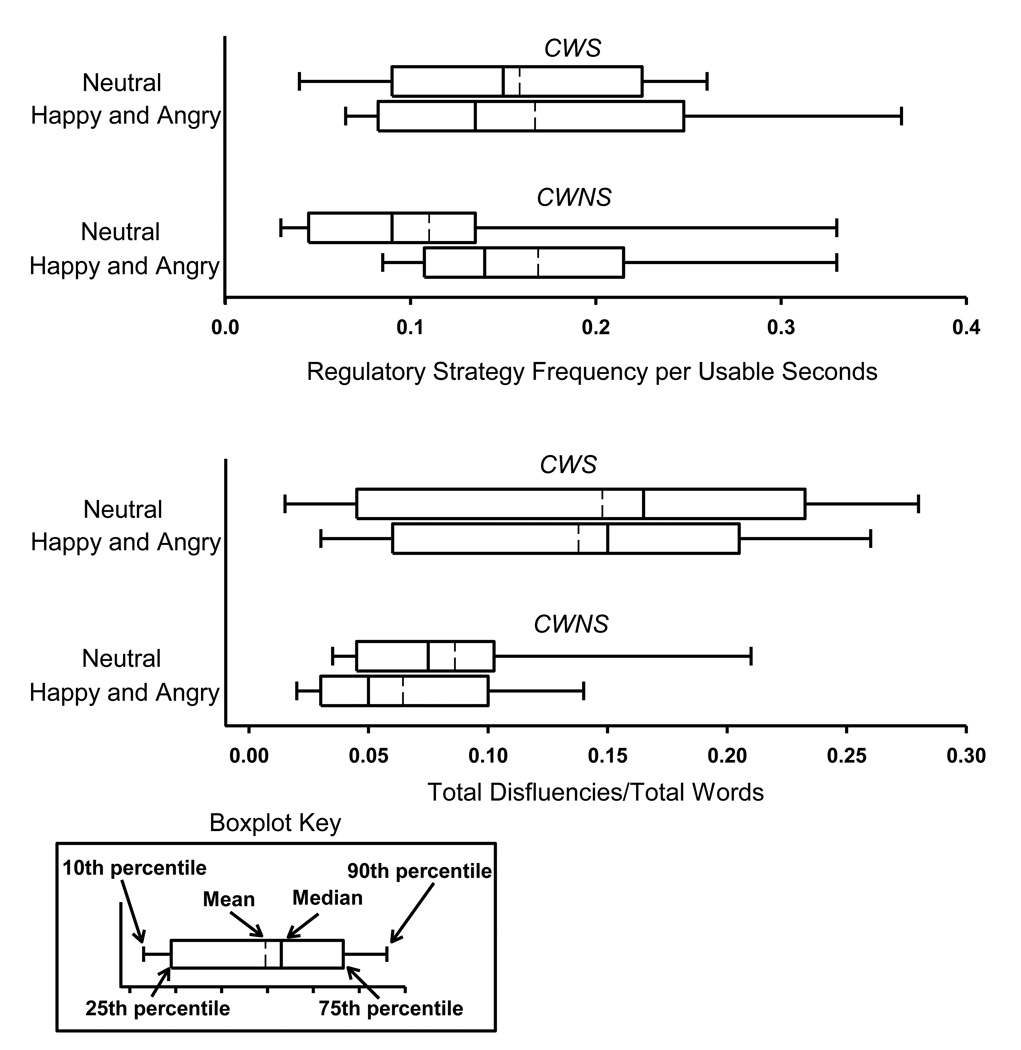
Figure 1.
For CWS (N = 9) and CWNS (N = 9), regulatory strategy frequency per usable seconds is displayed in a boxplot (Tukey, 1977) for the first minute of each narrative based on maximum likelihood estimates (upper panel). Also, for CWS and CWNS, total disfluencies/total words (TD/TW) for the first minute of each narrative, based on maximum likelihood estimates, are displayed the lower panel.

