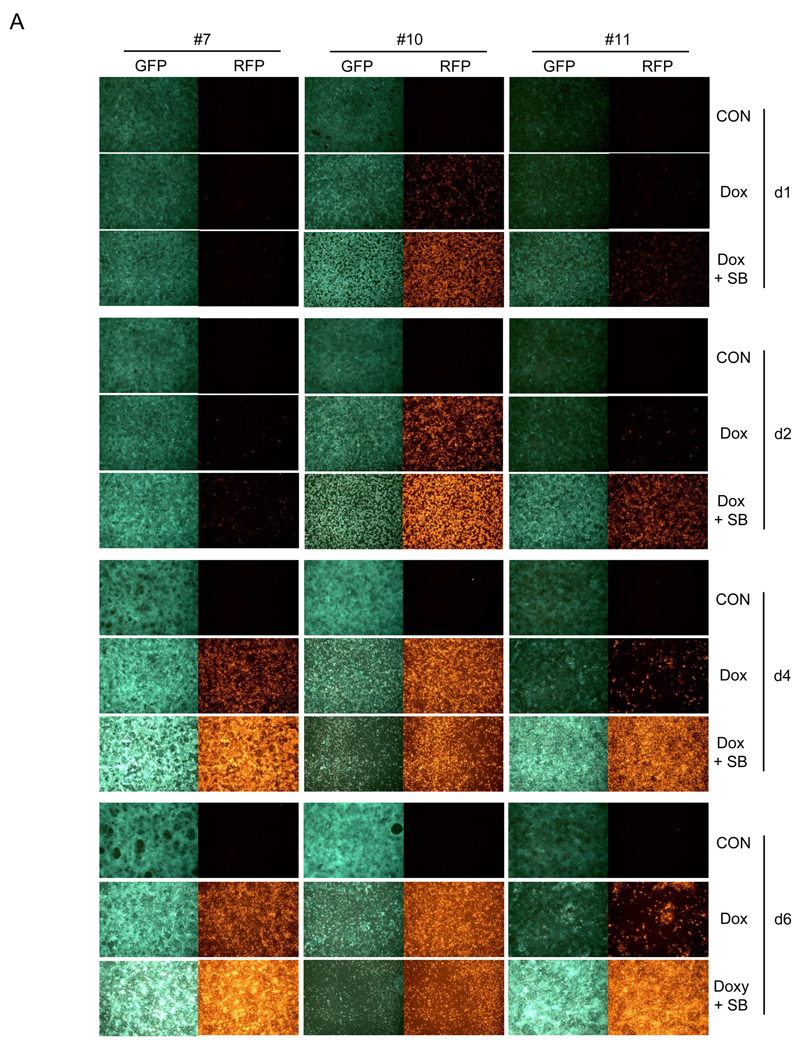
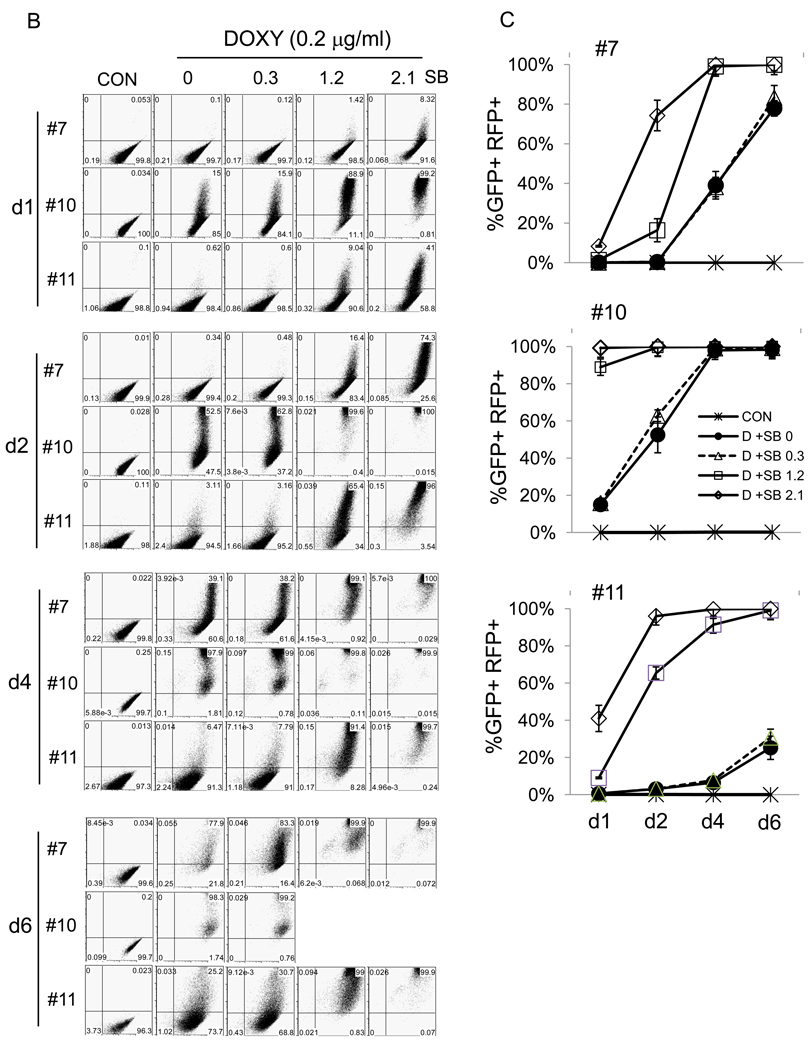
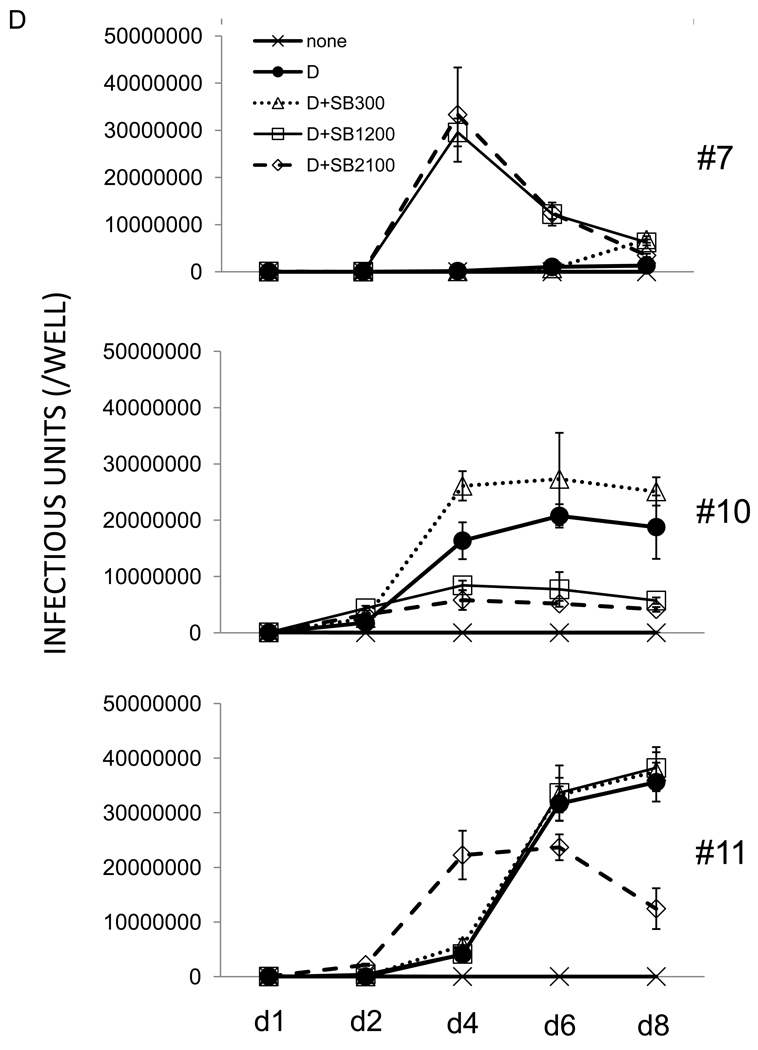
Figure 3. Characteristics of 3 representative clones from iSLK.219p10.
A) iSLK.219 #7, #10, and #11clones were left uninduced or induced by doxycycline (Dox, 1 µg/ml) alone or in combination with sodium butyrate (SB, 1.2 mM) for the indicated duration. GFP and RFP expression was examined under a fluorescent microscope and pictures were taken at 10X magnification. B) iSLK.219 subclones, left uninduced or induced as in A) were subjected to flow cytometry and their GFP and RFP expression was analyzed. One representative plot from 3 independent experiments is shown. X axis is for GFP and Y axis for RFP. Note that 2 plots for iSLK.219 #10 cells at d6 of induction by doxycycline and sodium butyrate (1.2 and 2.1 mM) are missing due to extensive cell death. C) Induction studies as in B) were repeated 3 times and the results were plotted. Each data point represents mean ± standard error mean. D) Infectious units in the culture supernatants of iSLK.219 subclones, induced as in C), were titrated on QBI293A cells. One representative data from 3 independent experiments is shown. Each data point represents mean ± standard error mean of triplicates.


