Fig. 1.

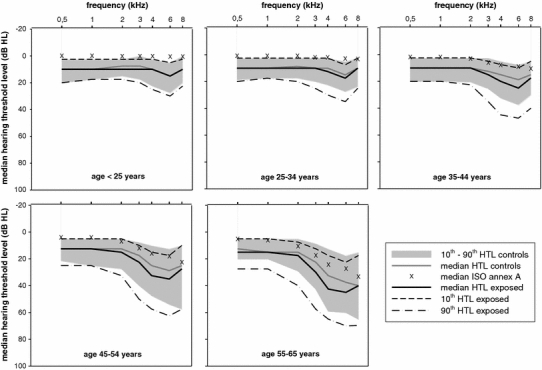
Measured hearing thresholds levels of the exposed workers (thick black lines), compared to the non-exposed internal controls (grey area) and age-matched ISO predictions of annex A (crosses), for five age groups

Measured hearing thresholds levels of the exposed workers (thick black lines), compared to the non-exposed internal controls (grey area) and age-matched ISO predictions of annex A (crosses), for five age groups