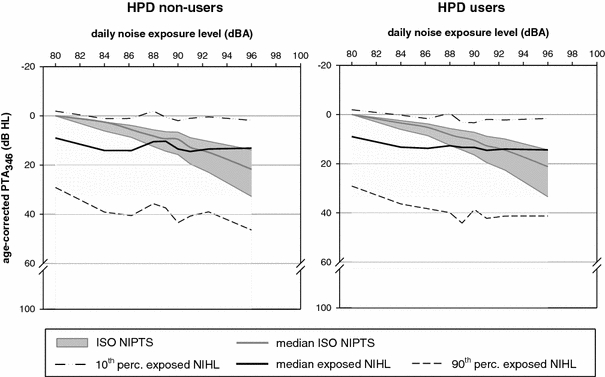
Fig. 3.

Median, 10th and 90th percentile age-corrected PTA3,4,6 values of exposed population (black lines) and NIPTS distribution calculated using ISO-1999 (grey area), as a function of daily noise exposure level. Left NIHL in HPD non-users. Right NIHL in HPD users
